

Preferential regulation of rabbit cardiac L-type Ca2+ current by glycolytic derived ATP via a direct allosteric pathway
- PMID: 9679164
- PMCID: PMC2231103
- DOI: 10.1111/j.1469-7793.1998.067bi.x
Preferential regulation of rabbit cardiac L-type Ca2+ current by glycolytic derived ATP via a direct allosteric pathway
Abstract
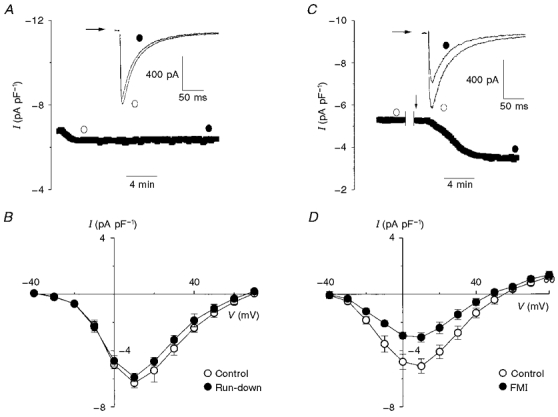
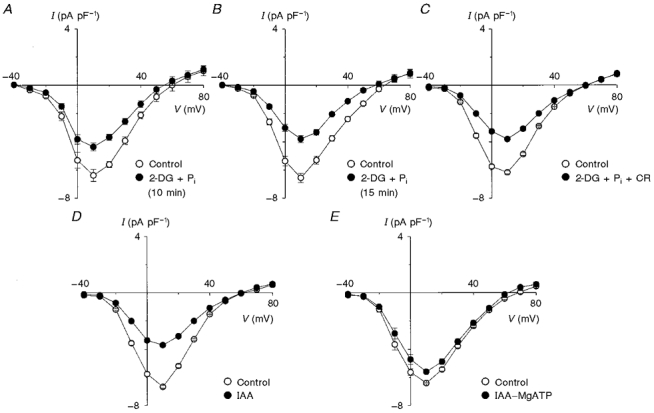
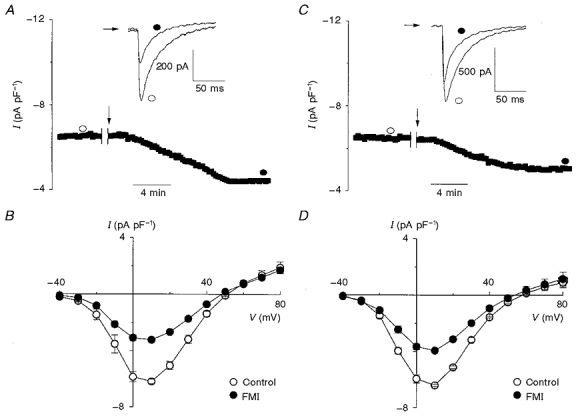
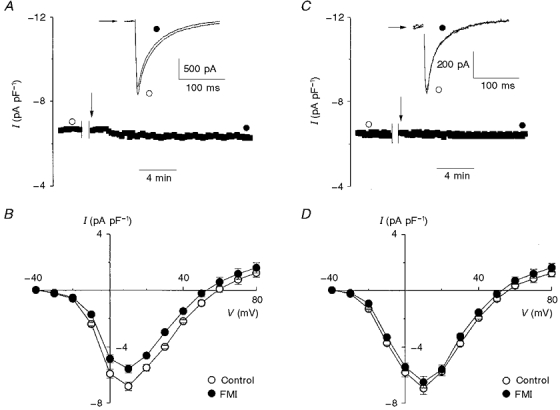
1. The activity of Ca2+ channels is regulated by a number of mechanisms including direct allosteric modulation by intracellular ATP. Since ATP derived from glycolysis is preferentially used for membrane function, we hypothesized that glycolytic ATP also preferentially regulates cardiac L-type Ca2+ channels. 2. To test this hypothesis, peak L-type Ca2+ currents (ICa) were measured in voltage-clamped rabbit cardiomyocytes during glycolytic inhibition (2-deoxyglucose + pyruvate), oxidative inhibition (cyanide + glucose) or both (full metabolic inhibition; FMI). 3. A 10 min period of FMI resulted in a 40.0 % decrease in peak ICa at +10 mV (-5.1 +/- 0.6 versus -3.1 +/- 0.4 pA pF-1; n = 5, P < 0.01). Similar decreases in peak ICa were observed during glycolytic inhibition using 2-deoxyglucose (-6.2 +/- 0.2 versus -3.7 +/- 0.2 pA pF-1; n = 5, P < 0.01) or iodoacetamide (-6.7 +/- 0.3 versus -3.7 +/- 0.2 pA pF-1; n = 7, P < 0.01), but not following oxidative inhibition (-6.2 +/- 0.4 versus -6.4 +/- 0.3 pA pF-1; n = 5, n.s.). The reduction in ICa following glycolytic inhibition was not mediated by phosphate sequestration by 2-deoxyglucose or changes in intracellular pH. 4. Reductions in ICa were still observed when inorganic phosphate and creatine were included in the pipette, confirming a critical role for glycolysis in ICa regulation. 5. With 5 mM MgATP in the pipette during FMI, peak ICa decreased by only 18.4 % (-6.8 +/- 0.6 versus -5.5 +/- 0.3 pA pF-1; n = 4, P < 0.05), while inclusion of 5 mM MgAMP-PCP (beta,gamma-methyleneadenosine 5'-triphosphate, Mg2+ salt) completely prevented the decrease in peak ICa (-6.9 +/- 0.3 versus -6.5 +/- 0.3 pA pF-1; n = 5, n.s.). 6. Together, these results suggest that ICa is regulated by intracellular ATP derived from glycolysis and does not require hydrolysis of ATP. This regulation is expected to be energy conserving during periods of metabolic stress and myocardial ischaemia.
Figures
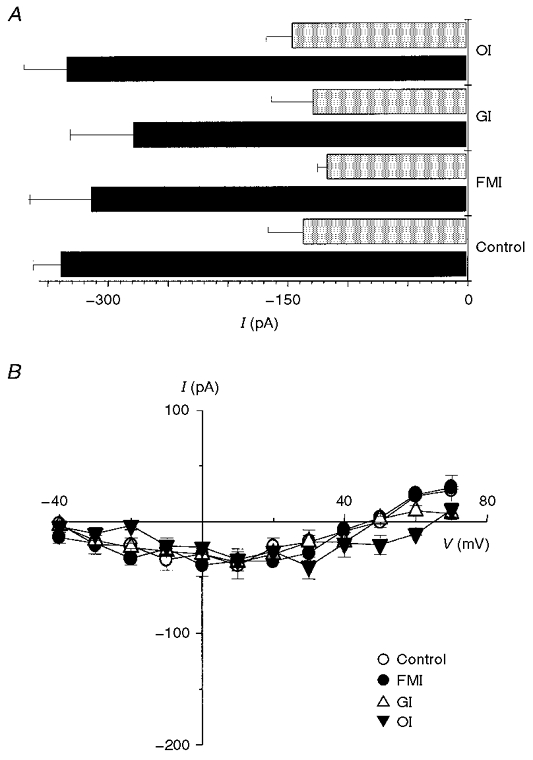
 ) for control, full metabolic inhibition (FMI), glycolytic inhibition (GI) and oxidative inhibition (OI). It is clearly evident that the holding current was similar at both -80 and -40 mV regardless of metabolic intervention (n= 5 for all groups). B, mean I-V relationships recorded 10 min after control conditions, FMI, GI and OI in the presence of 10 μM nifedipine were not significantly different (n= 5 for all groups).
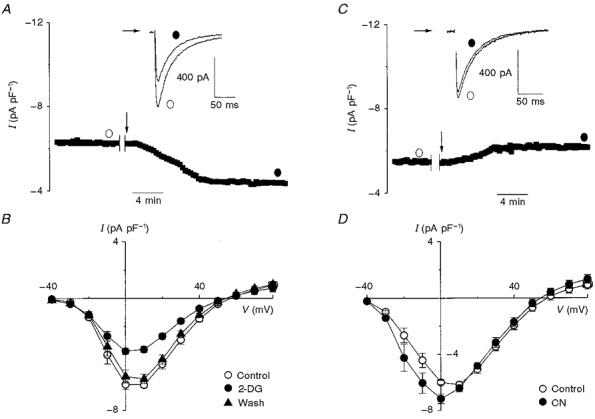
Similar articles
-
Cardiac ATP-sensitive K+ channels. Evidence for preferential regulation by glycolysis.J Gen Physiol. 1989 Nov;94(5):911-35. doi: 10.1085/jgp.94.5.911. J Gen Physiol. 1989. PMID: 2512370 Free PMC article.
-
Reduced L-type calcium current in ventricular myocytes from endotoxemic guinea pigs.Am J Physiol. 1997 Nov;273(5):H2312-24. doi: 10.1152/ajpheart.1997.273.5.H2312. Am J Physiol. 1997. PMID: 9374768
-
Mechanisms of excitation-contraction coupling failure during metabolic inhibition in guinea-pig ventricular myocytes.J Physiol. 1991 Nov;443:371-86. doi: 10.1113/jphysiol.1991.sp018838. J Physiol. 1991. PMID: 1822531 Free PMC article.
-
Tumor glycolysis as a target for cancer therapy: progress and prospects.Mol Cancer. 2013 Dec 3;12:152. doi: 10.1186/1476-4598-12-152. Mol Cancer. 2013. PMID: 24298908 Free PMC article. Review.
-
The mechanism of myocyte death in ischaemia.Eur Heart J. 1993 Nov;14 Suppl G:31-3. doi: 10.1093/eurheartj/14.suppl_g.31. Eur Heart J. 1993. PMID: 8287866 Review.
Cited by
-
Interrelationship Between Contractility, Protein Synthesis and Metabolism in Mantle of Juvenile Cuttlefish (Sepia officinalis).Front Physiol. 2019 Aug 23;10:1051. doi: 10.3389/fphys.2019.01051. eCollection 2019. Front Physiol. 2019. PMID: 31507433 Free PMC article.
-
Lysophosphatidic Acid Improves Human Sperm Motility by Enhancing Glycolysis and Activating L-Type Calcium Channels.Front Endocrinol (Lausanne). 2022 Jul 12;13:896558. doi: 10.3389/fendo.2022.896558. eCollection 2022. Front Endocrinol (Lausanne). 2022. PMID: 35903269 Free PMC article.
-
Metabolic inhibition reduces cardiac L-type Ca2+ channel current due to acidification caused by ATP hydrolysis.PLoS One. 2017 Aug 31;12(8):e0184246. doi: 10.1371/journal.pone.0184246. eCollection 2017. PLoS One. 2017. PMID: 28859158 Free PMC article.
-
Metabolic stress, reactive oxygen species, and arrhythmia.J Mol Cell Cardiol. 2012 Feb;52(2):454-63. doi: 10.1016/j.yjmcc.2011.09.018. Epub 2011 Sep 25. J Mol Cell Cardiol. 2012. PMID: 21978629 Free PMC article. Review.
-
Modulation of sarcoplasmic reticulum Ca2+ release by glycolysis in cat atrial myocytes.J Physiol. 2005 May 1;564(Pt 3):697-714. doi: 10.1113/jphysiol.2004.078782. Epub 2005 Feb 3. J Physiol. 2005. PMID: 15695247 Free PMC article.
References
-
- Anderson MP, Welsh MJ. Regulation by ATP and ADP of CFTR chloride channels that contain mutant nucleotide-binding domains. Science. 1992;257:1701–1704. - PubMed
-
- Backx PH, Marban E. Background potassium current active during the plateau of the action potential in guinea pig ventricular myocytes. Circulation Research. 1993;72:890–900. - PubMed
-
- Backx PH, O'Rourke B, Marban E. Flash photolysis of magnesium-DM-nitrophen in heart cells: a novel approach to probe magnesium- and ATP-dependent regulation of calcium channels. American Journal of Hypertension. 1991;4:416–421S. - PubMed
Publication types
MeSH terms
Substances
LinkOut - more resources
Full Text Sources
Miscellaneous