

Altered respiratory responses to hypoxia in mutant mice deficient in neuronal nitric oxide synthase
- PMID: 9679181
- PMCID: PMC2231102
- DOI: 10.1111/j.1469-7793.1998.273bi.x
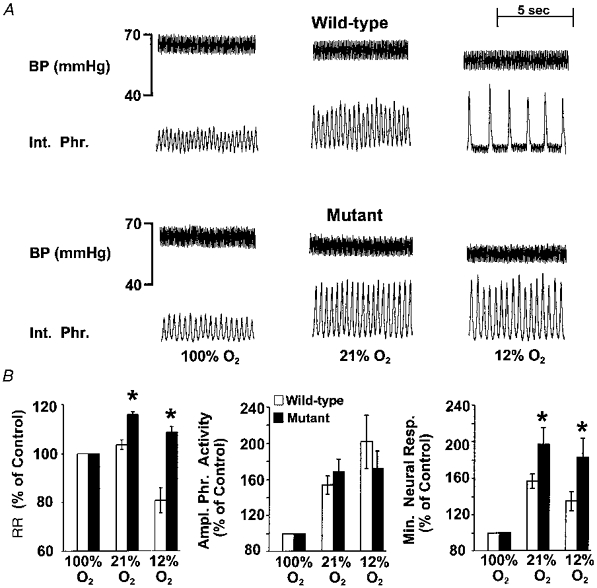
Altered respiratory responses to hypoxia in mutant mice deficient in neuronal nitric oxide synthase
Abstract
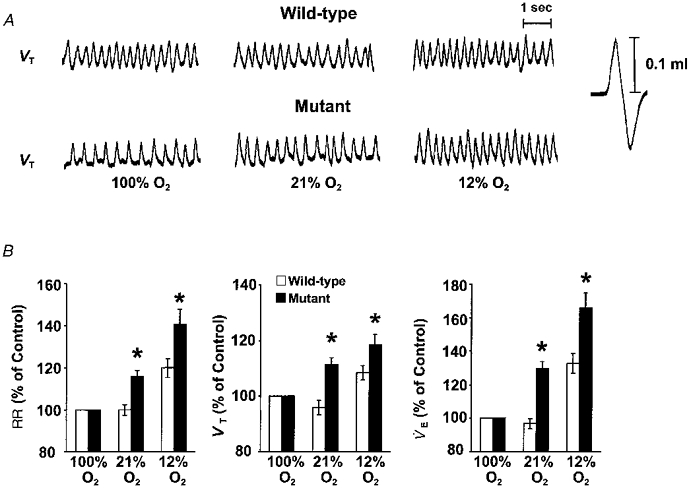
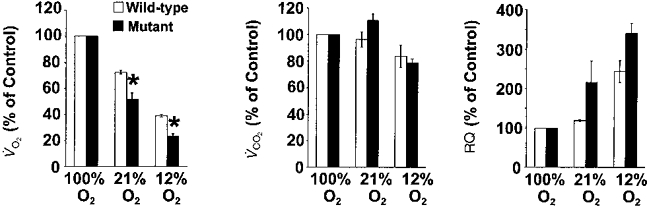
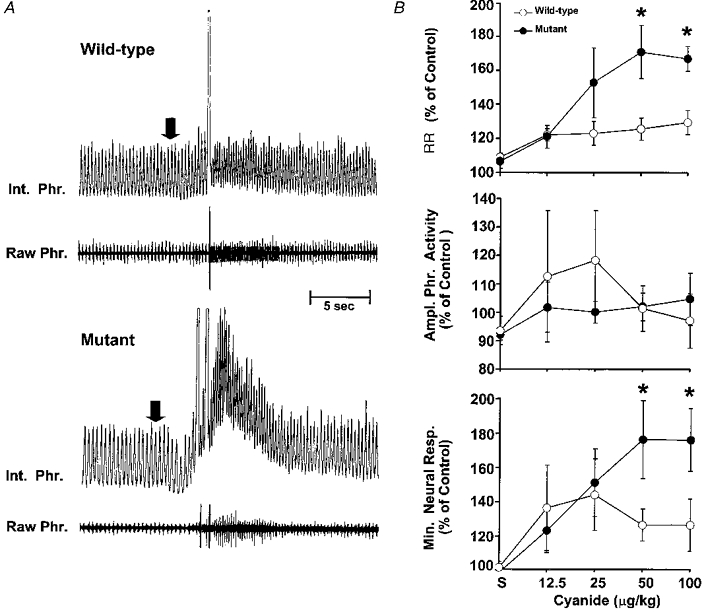
1. The role of endogenous nitric oxide (NO) generated by neuronal nitric oxide synthase (NOS-1) in the control of respiration during hypoxia and hypercapnia was assessed using mutant mice deficient in NOS-1. 2. Experiments were performed on awake and anaesthetized mutant and wild-type control mice. Respiratory responses to varying levels of inspired oxygen (100, 21 and 12% O2) and carbon dioxide (3 and 5% CO2 balanced oxygen) were analysed. In awake animals, respiration was monitored by body plethysmograph along with oxygen consumption (VO2), CO2 production (VCO2) and body temperature. In anaesthetized, spontaneously breathing mice, integrated efferent phrenic nerve activity was monitored as an index of neural respiration along with arterial blood pressure and blood gases. Cyclic 3',5'-guanosine monophosphate (cGMP) levels in the brainstem were analysed by radioimmunoassay as an index of nitric oxide generation. 3. Unanaesthetized mutant mice exhibited greater respiratory responses during 21 and 12% O2 than the wild-type controls. Respiratory responses were associated with significant decreases in oxygen consumption in both groups of mice, and the magnitude of change was greater in mutant than wild-type mice. Changes in CO2 production and body temperature, however, were comparable between both groups of mice. 4. Similar augmentation of respiratory responses during hypoxia was also observed in anaesthetized mutant mice. In addition, five of the fourteen mutant mice displayed periodic oscillations in respiration (brief episodes of increases in respiratory rate and tidal phrenic nerve activity) while breathing 21 and 12% O2, but not during 100% O2. The time interval between the episodes decreased by reducing inspired oxygen from 21 to 12% O2. 5. Changes in arterial blood pressure and arterial blood gases were comparable at any given level of inspired oxygen between both groups of mice, indicating that changes in these variables do not account for the differences in the response to hypoxia. 6. Respiratory responses to brief hyperoxia (Dejours test) and to cyanide, a potent chemoreceptor stimulant, were more pronounced in mutant mice, suggesting augmented peripheral chemoreceptor sensitivity. 7. cGMP levels were elevated in the brainstem during 21 and 12% O2 in wild-type but not in mutant mice, indicating decreased formation of nitric oxide in mutant mice. 8. The magnitude of respiratory responses to hypercapnia (3 and 5% CO2 balanced oxygen) was comparable in both groups of mice in the awake and anaesthetized conditions. 9. These observations suggest that the hypoxic responses were selectively augmented in mutant mice deficient in NOS-1. Peripheral as well as central mechanisms contributed to the altered responses to hypoxia. These results support the idea that nitric oxide generated by NOS-1 is an important physiological modulator of respiration during hypoxia.
Figures


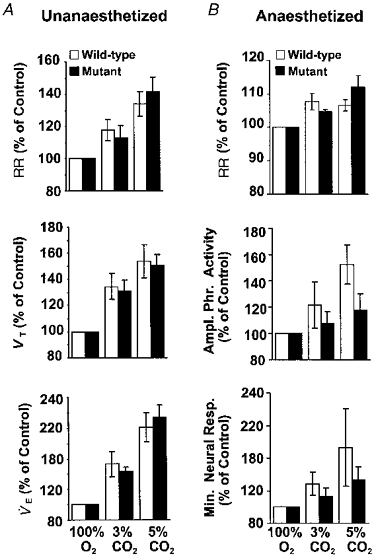
References
-
- Bartlett D, Tenney SM. Control of breathing in experimental anemia. Respiration Physiology. 1970;10:384–395. - PubMed
-
- Buelke-Sam J, Holson JF, Bazare JJ, Young JF. Comparative stability of physiological parameters during sustained anesthesia in rats. Laboratory Animal Science. 1978;28:157–162. - PubMed
-
- Chang CH, Kohse KP, Chang B, Hirata M, Jiang B, Douglas JE, Murad F. Characterization of ATP-stimulated guanylate cyclase activation in rat lung membranes. Biochimica et Biophysica Acta. 1990;1052:159–165. - PubMed
Publication types
MeSH terms
Substances
Grants and funding
LinkOut - more resources
Full Text Sources
Molecular Biology Databases