. 1998 Aug;180(15):3864-72.
doi: 10.1128/JB.180.15.3864-3872.1998.

Control by nutrients of growth and cell cycle progression in budding yeast, analyzed by double-tag flow cytometry

Affiliations

Control by nutrients of growth and cell cycle progression in budding yeast, analyzed by double-tag flow cytometry

L Alberghina et al. J Bacteriol. 1998 Aug.

Abstract

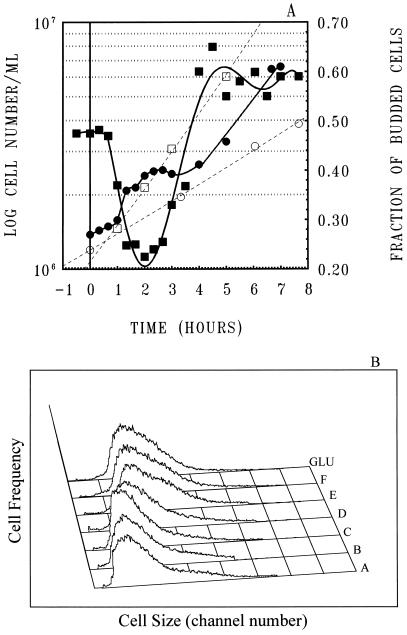
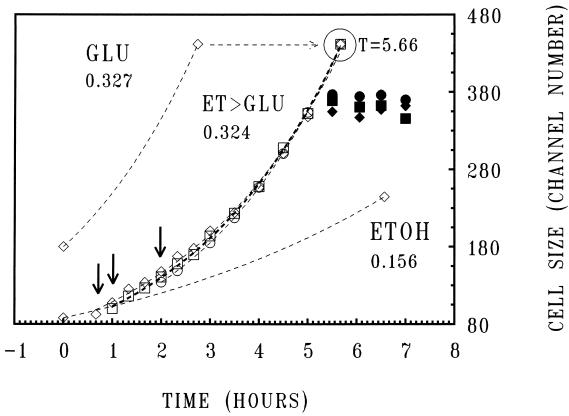
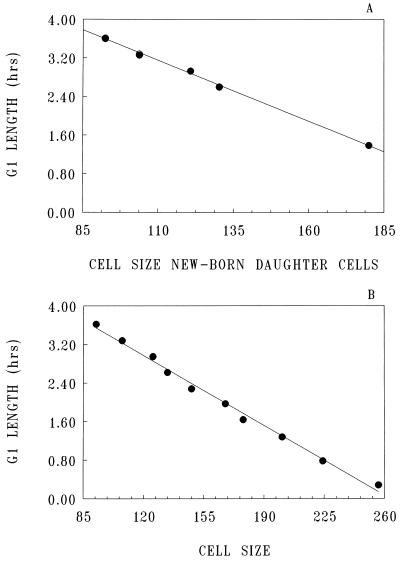
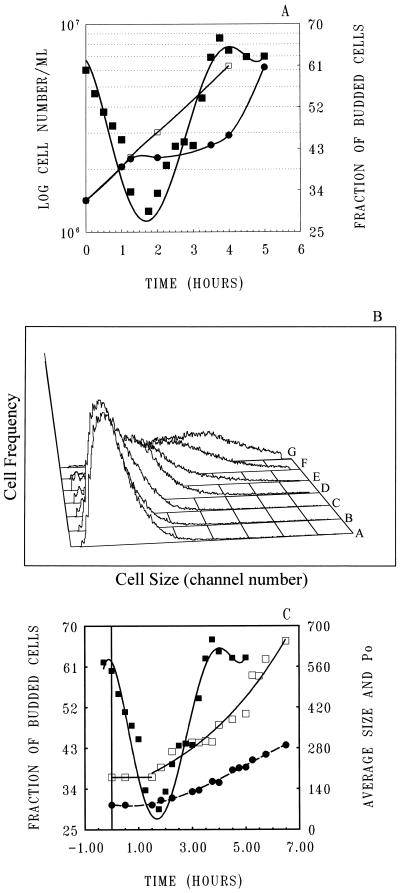
To gain insight on the interrelationships of the cellular environment, the properties of growth, and cell cycle progression, we analyzed the dynamic reactions of individual Saccharomyces cerevisiae cells to changes and manipulations of their surroundings. We used a new flow cytometric approach which allows, in asynchronous growing S. cerevisiae populations, tagging of both the cell age and the cell protein content of cells belonging to the different cell cycle set points. Since the cell protein content is a good estimation of the cell size, it is possible to follow the kinetics of the cell size increase during cell cycle progression. The analysis of the findings obtained indicates that both during a nutritional shift-up (from ethanol to glucose) and following the addition of cyclic AMP (cAMP), two important delays are induced. The preexisting cells that at the moment of the nutritional shift-up were cycling before the Start phase delay their entrance into S phase, while cells that were cycling after Start are delayed in their exit from the cycle. The combined effects of the two delays allow the cellular population that preexisted the shift-up to quickly adjust to the new growth condition. The effects of a nutritional shift-down were also determined.


Figures

FIG. 1
FIG. 1
Effects of a nutritional shift-up on the FBC value, cell concentration, and distribution of the cellular protein content. (A) S288C yeast cells were grown on ethanol-YNB medium to balanced exponential phase (0.156 h−1), harvested, washed, and inoculated in fresh glucose-YNB medium at t = 0. The specific growth rate and the FBC of the control yeast population exponentially growing on glucose-YNB were 0.352 h−1 and 0.58, respectively. The specific growth rate of the yeast population upon reaching the balanced growth conditions was 0.327 h−1. Symbols: ○, number of cells per milliliter for the control yeast population growing on ethanol-YNB; □, number of cells per milliliter for the control yeast population growing on glucose-YNB; •, number of cells per milliliter for the yeast population growing during the nutritional shift-up from ethanol to glucose; ■, FBC for the yeast population growing during the nutritional shift-up from ethanol to glucose. (B) At different times after resuspension, samples of the culture were withdrawn, and the cell proteins were stained with TRITC and analyzed at t = 0 h (A), t = 1 h (B), t = 2 h (C), t = 3 h (D), t = 4 h (E), and t = 6 h (F). GLU, distribution of the cellular protein content of the control yeast population growing on glucose-YNB.
FIG. 2
FIG. 2
Dynamic of the double tagging over time for cells grown on ethanol-YNB, stained with ConA-FITC, and resuspended in glucose-YNB medium. (A) At different times after resuspension, samples of the culture were withdrawn and cell proteins were stained with TRITC. The cell wall tag (abscissa: ConA-FITC, channel number) and cell size tag (ordinate: TRITC, channel number) signals were acquired with a linear scale. During the acquisition of data at time t = 0, only the cells with lower ConA-FITC signals (i.e., the smaller cells) were acquired (St., completely stained), and the settings were not changed during the experiment. This approach provides evidence of even the smallest differences in the ConA-FITC fluorescence signals between individual cells (26, 27). The evolution of partially stained (P.St.) and then unstained (Un.) cells over time is clearly visible. The diagram at the top of panel A shows the cell cycle phases of a growing yeast cell. (B) Cell protein content value of cohorts of newborn daughter Po cells born at different times after resuspension. S288C yeast cells were grown in ethanol-YNB medium till the exponential phase; they were then stained with ConA-FITC, resuspended in glucose-YNB medium, and processed as described in Fig. 2A. Examples of selection of the regions where newborn daughter cells were located after birth are indicated by gates R1 (t = 0.66), R2 (t = 1.0), R3 (t = 2), R4 (t = 3) and R5 (t = 4) in Fig. 2A. To obtain the data after t = 4, cells from parallel and independent experiments were collected, completely stained with ConA-FITC, resuspended in the same medium, and processed as already indicated. Newborn daughter cells born on ethanol or glucose (controls, open symbols) were selected by applying the same procedure to yeast cells exponentially growing on ethanol or glucose. Data are expressed as the average channel number of the relative protein content distributions (TRITC signals).
FIG. 3
FIG. 3
Average cell protein content (TRITC signals) of selected cohorts of partially stained daughter cells as a function of time after birth during the transitory state of growth. S288C yeast cells were grown in ethanol-YNB medium until the exponential phase; they were then stained with ConA-FITC, resuspended in glucose-YNB medium, and processed as described for Fig. 2A. (Since, from birth to division, the surface label does not change, the gate R1 in Fig. 2A selects the same cohort of partially stained daughter cells over time.) The figure shows the average cell protein content (TRITC signal) of selected cohorts of daughter cells born at different times (i.e., 0.666 h [◊ and ⧫], 1 h [□ and ■], and 2 h [○ and •]; see arrows) after resuspension. Data represented with the open symbols clearly fit an exponential increase of the cell size over time (in each case the coefficient of correlation is higher than 0.99), while the data represented by the closed symbols show that an exponential rate law cannot be utilized. Starting from t = 0 are also reported data for the cell size increase for daughter cells exponentially growing on ethanol or during the balanced-growth phase on glucose (i.e., the controls). These values have been calculated by taking into consideration the estimated specific growth rate of the daughter populations (0.156 and 0.327 h−1, respectively), the estimated cell size values of the daughter cells at birth, and the calculated generation times of the daughter subpopulations (the generation times of the daughter populations were calculated, by using a previously developed mathematical model, to be 6.56 and 2.74 h for the yeast populations growing on ethanol and glucose, respectively). The same data were obtained by using equation 2 as described in the text). The cell size value of the dividing daughter cells during exponential growth on glucose (i.e., the control) has been used to extrapolate (dashed arrow) the correct cell sizes of the different cohorts of daughter cells at division (data in the circle). Data are expressed as the average channel number of the relative protein content distributions (TRITC signals).
FIG. 4
FIG. 4
Cell size of newborn daughter cells produced during the shift-up relative to their G1 durations. (A) The cell sizes of the newborn daughter cells were determined as described in Fig. 2; their G1 durations were determined as described in Table 1. (B) Cell sizes during cell cycle progression for the cohort of daughter cells originated at t = 0.666 (Fig. 3) relative to the remaining G1 phase duration. Data are expressed as the average channel number of the relative protein content distributions (TRITC signals).
FIG. 5
FIG. 5
Effect of the addition of cAMP on the FBC value, number of cells per milliliter, distribution of the cellular protein content, and Po cell values. To OL214 yeast cells grown on glucose-YNB medium to balanced exponential phase (duplication time, 1.86 h), cAMP was added at time t = 0 (final concentration, 3 mM). (A) Symbols: □, number of cells per milliliter for the control yeast population growing on glucose; •, number of cells per milliliter for the yeast population after addition of cAMP; ■, FBC for the yeast population after the addition of cAMP. (B) At different times after resuspension, samples of the culture were withdrawn, and the cell proteins were stained with TRITC and analyzed at t = 0 h (A), t = 1.5 h (B), t = 1.83 h (C), t = 3 h (D), t = 3.5 h (E), t = 4.5 h (F), and t = 6 h (G). (C) Behavior of the average cell size of the population (□), the average cell size of the newborn daughter cells, Po (•), and the FBC in the population (■) for the yeast population growing after the addition of cAMP. Po and the average cell size of the population are expressed as the average channel number of the relative protein content distributions (TRITC signals).

References

    1. Alberghina L, Mariani L, Martegani E, Vanoni M. Analysis of protein distribution in budding yeast. Biotechnol Bioeng. 1983;25:1295–1310. - PubMed
    1. Alberghina L, Martegani E, Mariani L, Bortolan G. A bimolecular mechanism for the cell size control of the cell cycle. BioSystems. 1984;16:297–305. - PubMed
    1. Alberghina L, Porro D. Quantitative flow cytometry: analysis of protein distributions in budding yeast. A mini-review. Yeast. 1993;9:815–823. - PubMed
    1. Alberghina L, Ranzi B M, Porro D, Martegani E. Flow cytometry and cell size kinetics in continuous and fed-batch fermentations of budding yeast. Biotechnol Prog. 1991;7:299–304. - PubMed
    1. Ballou C E. Yeast cell wall and cell surface: metabolism and gene expression. In: Strathern J N, Jones E W, Broach J R, editors. The molecular biology of the yeast Saccharomyces cerevisiae. Cold Spring Harbor, N.Y: Cold Spring Harbor Laboratory; 1982. pp. 335–360.

LinkOut - more resources