. 1998 Aug;180(15):3917-22.
doi: 10.1128/JB.180.15.3917-3922.1998.

Regulation of porin-mediated outer membrane permeability by nutrient limitation in Escherichia coli

Affiliations

Regulation of porin-mediated outer membrane permeability by nutrient limitation in Escherichia coli

X Liu et al. J Bacteriol. 1998 Aug.

Abstract

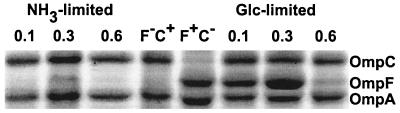
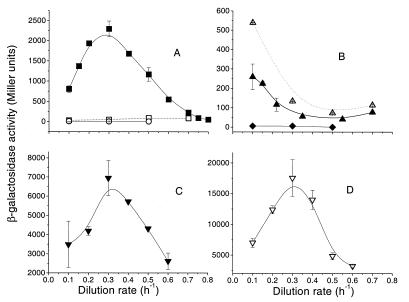
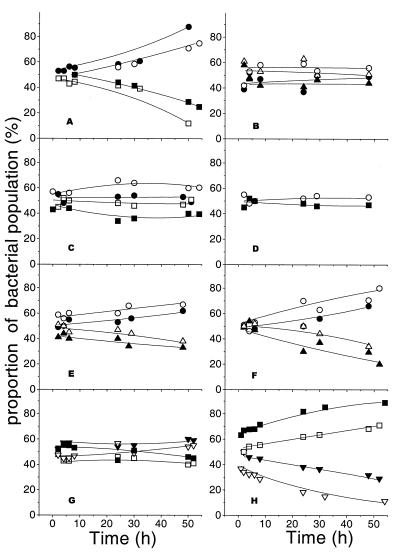
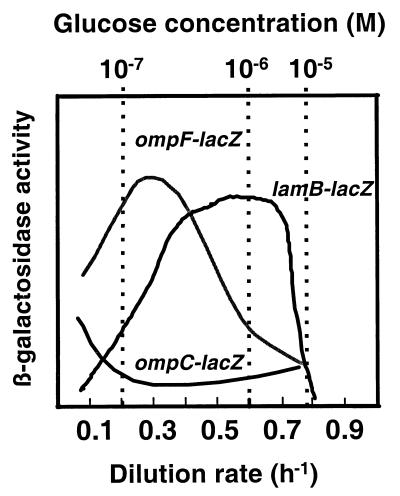
OmpF and OmpC porins were differentially regulated by nutrient limitation and growth rate in glucose- or nitrogen-limited chemostat cultures of Escherichia coli. Transcriptional and translational ompF fusions showed a sharp peak of expression under glucose limitation at D = 0.3 h-1, with lower amounts at lower and higher growth rates. The peak of OmpR-dependent transcriptional stimulation of ompF under glucose limitation in minimal salts media was about 20-fold above nutrient excess levels and 3-fold higher than that achieved with low osmolarity. Analysis of outer membrane protein levels and results of growth competition experiments with porin mutants were consistent with the enhanced role of OmpF under glucose limitation, but not N limitation. In contrast, OmpC was the major porin under N limitation but was increasingly expressed under glucose limitation at very low growth rates approaching starvation, when OmpF was downregulated. In summary, outer membrane permeability under N-limited, sugar-rich conditions is largely based on OmpC, whereas porin activity is a complex, highly sensitive function of OmpF, OmpC, and LamB glycoporin expression under different levels of glucose limitation. Indeed, the OmpF level was more responsive to nutrient limitation than to medium osmolarity and suggested a significant additional layer of control over the porin-regulatory network.


Figures

FIG. 1
FIG. 1
Outer membrane protein profile of E. coli K-12 wild-type strain MC4100 under glucose and NH3 limitation at dilution rates of 0.1, 0.3, and 0.6 h−1. OmpF and OmpC bands were identified by comparison to the reference strains MH513 and MH225 (FC+) and (F+C), respectively.
FIG. 2
FIG. 2
OmpF and OmpC expression under nutrient limitation. The transcriptional and translational expression levels of porins are shown under glucose and NH3 limitation at different dilution rates. The expression of ompF and ompC genes was monitored by measuring β-galactosidase activities of ompF-lacZ transcriptional fusion in MH513 (■, glucose limitation; □, N limitation) and BW3303 (○, glucose limitation) (A), ompC-lacZ transcriptional fusion in MH225 (▴, glucose limitation; ▵, N limitation) and BW3304 (⧫, glucose limitation) (B), ST010 (▾, ompF operon fusion) with glucose limitation (C), and ST100 (▿, ompF protein fusion), also with glucose limitation (D). The plotted data represents the means of two to five independent determinations at each dilution rate in chemostats.
FIG. 3
FIG. 3
Growth competition between pairs of strains lacking particular porin proteins. Experiments were performed with strains containing the selectable metC::Tn10 marker (open symbols) and those without this marker (solid symbols). Experiments were with glucose and N limitation (with NH3 or histidine limitation) at a dilution rate of 0.3 h−1. The same strains were tested in panels A, C, and D: the OmpF+ OmpC+ LamB+ strains MC4100 (•) and BW3340 (○), competing against OmpF strains BW3337 (□) and MH513 (■) under glucose (A), NH3 (C), and histidine (D) limitation. The strains in panels B, E, and F were MC4100 (•) and BW3340 (○), competing against OmpC strains BW3338 (▵) and MH225 (▴) under glucose (B), NH3 (E), and histidine (F) limitation. In panels G and H, the strains were the LamB+ OmpF strains MH513 (■) and BW3337 (□), competing against LamB OmpF+ strains BW2951 (▾) and BW3339 (▿) under NH3 and glucose limitation.
FIG. 4
FIG. 4
OmpF, OmpC, and LamB expression patterns during glucose-limited growth in the chemostat. The curves are based on data from Fig. 2 as well as from reference .

Similar articles

Cited by

References

    1. Andersen J, Delihas N. micF RNA binds to the 5′ end of ompF mRNA and to a protein from Escherichia coli. Biochemistry. 1990;29:9249–9256. - PubMed
    1. Brown M R W, Collier P J, Gilbert P. Influence of growth rate on susceptibility to antimicrobial agents: modification of the cell envelope and batch and continuous culture studies. Antimicrob Agents Chemother. 1990;34:1623–1628. - PMC - PubMed
    1. Cohen S P, McMurry L M, Levy S B. marA locus causes decreased expression of OmpF porin in multiple-antibiotic-resistant (Mar) mutants of Escherichia coli. J Bacteriol. 1988;170:5416–5422. - PMC - PubMed
    1. Death A, Notley L, Ferenci T. Derepression of LamB protein facilitates outer membrane permeation of carbohydrates into Escherichia coli under conditions of nutrient stress. J Bacteriol. 1993;175:1475–1483. - PMC - PubMed
    1. Ferenci T. Adaptation to life at micromolar nutrient levels: the regulation of Escherichia coli glucose transport by endoinduction and cAMP. FEMS Microbiol Rev. 1996;18:301–317. - PubMed

Publication types

MeSH terms

LinkOut - more resources