. 1998 Aug 3;188(3):483-95.
doi: 10.1084/jem.188.3.483.

Regulation of B cell development by variable gene complexity in mice reconstituted with human immunoglobulin yeast artificial chromosomes

Affiliations

Regulation of B cell development by variable gene complexity in mice reconstituted with human immunoglobulin yeast artificial chromosomes

L L Green et al. J Exp Med. .

Abstract

The relationship between variable (V) gene complexity and the efficiency of B cell development was studied in strains of mice deficient in mouse antibody production and engineered with yeast artificial chromosomes (YACs) containing different sized fragments of the human heavy (H) chain and kappa light (L) chain loci. Each of the two H and the two kappa chain fragments encompasses, in germline configuration, the same core variable and constant regions but contains different numbers of unique VH (5 versus 66) or Vkappa genes (3 versus 32). Although each of these YACs was able to substitute for its respective inactivated murine counterpart to induce B cell development and to support production of human immunoglobulins (Igs), major differences in the efficiency of B cell development were detected. Whereas the YACs with great V gene complexity restored efficient development throughout all the different recombination and expression stages, the YACs with limited V gene repertoire exhibited inefficient differentiation with significant blocks at critical stages of B cell development in the bone marrow and peripheral lymphoid tissues. Our analysis identified four key checkpoints regulated by VH and Vkappa gene complexity: (a) production of functional mu chains at the transition from the pre B-I to the pre B-II stage; (b) productive VkappaJkappa recombination at the small pre B-II stage; (c) formation of surface Ig molecules through pairing of mu chains with L chains; and (d) maturation of B cells. These findings demonstrate that V gene complexity is essential not only for production of a diverse repertoire of antigen-specific antibodies but also for efficient development of the B cell lineage.


Figures

Figure 1
Figure 1
Schematic representation of human H and κ chain YACs introduced into XenoMouse strains I and II. The structure of human Ig YACs in XenoMouse I (yH1, yK1) and II (yH2, yK2) with respect to the human Ig loci (references and 42), their sizes, and non-Ig sequences are indicated (not shown to scale). The YAC vector elements telomere (arrowhead), centromere (black circle), mammalian (HPRT, Neo), and yeast (TRP1, ADE2, LYS2, URA3) selectable markers on the YAC vector arms are indicated. VH segments are classified as genes with open reading frame (black circle), pseudogenes (white square), and nonrearranged genes with open reading frames that can also be classified as pseudogenes (gray circle; reference 43). Vκ segments are classified as genes with open reading frames (black circle) and pseudogenes (white square).
Figure 2
Figure 2
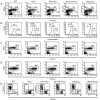
Restoration of B cell development by yH transgenes in mJH −/− mice. Analysis of bone marrow (A–D) or spleen (E) of wild-type (WT), JH-deleted (mJH −/−), hemizygous yH1;mJH −/−, homozygous yH1/yH1;mJH −/−, hemizygous yH2;mJH −/−, or TG;mJH −/− mice. Four-color flow cytometry was performed using antibodies against (A) B220 and mouse or human μ; (B) c-kit and CD25 in the B220+μ population gated from A; (C) forward scatter size distribution of the B220+μc-kitCD25+ population gated from B; (D) HSA and BP-1 in the B220+CD43+ gated population; and (E) B220 and mouse or human μ. The percentage of positive cells within a quadrant or region is indicated. The data shown are representative of those obtained from multiple animals. The mean numbers of B220+μ+ cells in the spleen were 39 ± 2 × 10⁶ for wild-type (n = 3), 0 for mJH −/− (n = 3), 2 ± 2 × 10⁶ for yH1;mJH −/− (n = 3), 5 ± 2 × 10⁶ for yH1/yH1;mJH −/− (n = 7), 22 ± 5 × 10⁶ for yH2;mJH −/− (n = 5), and 25 ± 7 × 10⁶ for TG;mJH −/− mice (n = 5). The mean numbers of B220+μ cells in the bone marrow were 4.7 ± 1.4 × 10⁶ for wild-type (n = 3), 2.4 ± 0.7 × 10⁶ for mJH −/− (n = 3), 5.5 ± 0.2 × 10⁶ for yH1; mJH −/− (n = 3), 8.4 ± 3.8 × 10⁶ for yH1/ yH1;mJH −/− (n = 7), 3.5 ± 1.0 × 10⁶ for yH2;mJH −/− (n = 5), and 1.5 ± 0.7 × 10⁶ for TG;mJH −/− mice (n = 5).
Figure 3
Figure 3
Restoration of B cell development by yK transgenes in mCκ−/− mice. Analysis of bone marrow (A and B), peripheral blood lymphocytes (C and E), or lymph nodes (D) of wild-type (WT), Cκ-deleted (mCκ−/−), hemizygous yK1;mCκ−/−; homozygous yK1/yK1;mCκ−/−, hemizygous yK2;mCκ−/−, or homozygous yK2/yK2; mCκ−/− (E only) mice. Four-color flow cytometry was performed using antibodies against (A) B220 versus mouse μ; (B) forward scatter size distribution of the gated B220+μc-kitCD25+ population; (C and D) B220 and mouse μ; and (E) mouse κ or human κ and mouse λ in the gated B220+μ+ population. The percentage of positive cells within a quadrant or region is indicated. The data shown are representative of those obtained from multiple animals. The mean numbers of B220+μ+ cells in the spleen were 33 ± 4 × 10⁶ for wild-type (n = 3), 11 ± 2 × 10⁶ for mCκ−/− (n = 3), 19 ± 4 × 10⁶ for yK1;mCκ−/− (n = 6), 20 ± 6 × 10⁶ for yK1/yK1;mCκ−/− (n = 6), and 25 ± 8 × 10⁶ for yK2;mCκ−/− mice (n = 5). The mean numbers of B220+μ+ cells in the blood and lymph nodes were not assayed. The percentages of B220+μ+ cells in the spleens of the mice shown in the figure were 54.0 for wild-type, 38.7 for mCκ−/−, 47.0 for yK1;mCκ−/−, 47.9 for yK1/yK1;mCκ−/−, and 56.6 for yK2;mCκ−/− mice. The mean numbers of B220+μ cells in the bone marrow were 3.2 ± 1.9 × 10⁶ for wild-type (n = 3), 9.9 ± 3.7 × 10⁶ for mCκ−/− (n = 3), 12.2 ± 4.7 × 10⁶ for yK1;mCκ−/− (n = 6), 9.3 ± 5.0 × 10⁶ for yK1/yK1;mCκ−/− (n = 6), and 6.2 ± 4.3 × 10⁶ for yK2;mCκ−/− mice (n = 6).
Figure 4
Figure 4
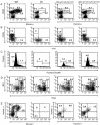
Restoration of B cell development in bone marrow of XenoMouse I. Analysis of bone marrow (A–E) of wild-type (WT), DI (mJH −/−; mCκ−/−), XenoMouse I hemizygous for yH1 and homozygous for yK1, and XenoMouse I homozygous for yH1 and yK1. Four-color flow cytometry was performed using antibodies against (A) B220 and mouse or human μ; (B) c-kit and CD25 in the B220+μ population gated from A; (C) forward scatter size distribution of the B220+μc-kitCD25+ population gated from B; (D) HSA and BP-1 in the B220+CD43+ gated population; and (E) mouse δ and mouse μ or human δ and human μ in the B220+CD43 gated population. The percentage of positive cells within a quadrant or region is indicated. The data shown are representative of three wild-type, three DI, and eight XenoMouse I mice of each genotype. The mean numbers of B220+μ cells in the bone marrow were 6.5 ± 2.5 × 10⁶ for wild-type, 2.4 ± 1.6 × 10⁶ for DI, 4.7 ± 1.7 × 10⁶ for yH1;yK1/yK1;DI, and 9.3 ± 3.5 × 10⁶ for yH1/yH1;yK1/yK1;DI. The mean numbers of B220loμ+ cells in the bone marrow were 2.8 ± 1.1 × 10⁶ for wild-type, 0.5 ± 0.2 × 10⁶ for yH1;yK1/yK1;DI, and 1.1 ± 0.4 × 10⁶ for yH1/yH1;yK1/yK1;DI. The mean numbers of B220hiμ+ cells in the bone marrow were 2.8 ± 1.1 × 10⁶ for wild-type, 0.2 ± 0.1 × 10⁶ for yH1;yK1/yK1;DI, and 0.5 ± 0.2 × 10⁶ for yH1/yH1;yK1/yK1;DI.
Figure 5
Figure 5
Summary of B cell development in the bone marrow of Ig-inactivated mice engineered with yH and yK YACs. Restoration values of B cell populations at the different developmental stages, for each of the mouse strains analyzed, are given relative to those of wild-type mice (WT), which are presented as 100%. The data are representative of average values for multiple animals (see other figure legends). The mouse strains are presented by the genotypes of yH and yK transgenes on the mouse Ig-inactivated backgrounds. Stages of B cell development and the correlated status of H and L chain rearrangement are outlined according to Rolink and Melchers (reference 2) or Hardy and Hayakawa (reference 1). The comparison of the two systems represents only our best approximation of the correlation. G, Ig genes in germline configuration; arrows, Ig genes in the process of rearrangement. Shading, Percentages of the cells at each developmental stage, relatively proportional to that in wild-type mice. Fr, Fraction.
Figure 6
Figure 6
B cell maturation in spleen of XenoMouse I and XenoMouse II strains. Analysis of B splenocytes from wild-type (WT), DI (mJH −/−; mCκ−/−), XenoMouse I (homozygous for yH1 and yK1), XenoMouse II (hemizygous for yH2; homozygous for yK2), and XenoMouse II.3 (homozygous yH2 and yK2) mice. Four-color flow cytometry was performed using antibodies against (A) B220 versus mouse or human μ; (B) HSA and B220; (C) mouse δ and mouse μ or human δ and human μ in the gated B220+ population; (D) mouse λ and mouse κ or human κ in the gated B220+μ+ population. The percentage of positive cells within a quadrant or region is indicated. The data shown are representative of multiple animals. The mean numbers of B220+μ+ cells in the spleen were 68 ± 13 for wild-type (n = 3), 0 for DI (n = 3), 15 ± 3 for XenoMouse I (n = 4), and 24 ± 15 for XenoMouse II (n = 10).
Figure 7
Figure 7
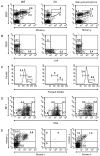
Restoration of B cell development in bone marrow of XenoMouse II. Analysis of bone marrow (A–E) of wild-type (WT), DI (mJH −/−; mCκ−/−), and XenoMouse II (hemizygous for yH2 and homozygous for yK2). Four-color flow cytometry was performed using antibodies against (A) B220 and mouse or human μ; (B) c-kit and CD25 in the B220+μ population gated from A; (C) forward scatter size distribution of the B220+μc-kitCD25+ population gated from B; (D) HSA and BP-1 in the B220+CD43+ gated population; and (E) mouse δ and mouse μ or human δ and human μ in the B220+CD43 gated population. The percentage of positive cells within a quadrant or region is indicated. The data shown are representative of multiple animals. The mean numbers of B220+μ cells in the bone marrow were 2.3 ± 0.6 × 10⁶ for wild-type (n = 3), 1.6 × 10⁶ for DI (n = 1), and 1.8 ± 1.0 × 10⁶ for XenoMouse II (n = 5). The mean numbers of B220loμ+ cells in the bone marrow were 0.8 ± 0.2 × 10⁶ for wild-type (n = 3), 0 for DI (n = 1), and 0.3 ± 0.2 × 10⁶ for XenoMouse II (n = 5). The mean numbers of B220hiμ+ cells in the bone marrow were 0.8 ± 0.1 × 10⁶ for wild-type (n = 3), 0 for DI (n = 1), and 0.3 ± 0.1 × 10⁶ for XenoMouse II (n = 5).
Figure 8
Figure 8
Human μ chains function to support B cell proliferation in vitro. B cells were enriched from pooled suspensions of splenocytes from wild-type, yH1;mJH −/−, or yH2;mJH −/− mice, then stimulated to proliferate in vitro using (A) LPS or (B) anti–mouse μ or anti–human μ F(ab′)2, as described in Materials and Methods. The data are presented as total cpm incorporated; bar indicates SEM. Background incorporation of [3H]thymidine in nonstimulated cultures was 400–2,700 cpm.
Figure 8
Figure 8
Human μ chains function to support B cell proliferation in vitro. B cells were enriched from pooled suspensions of splenocytes from wild-type, yH1;mJH −/−, or yH2;mJH −/− mice, then stimulated to proliferate in vitro using (A) LPS or (B) anti–mouse μ or anti–human μ F(ab′)2, as described in Materials and Methods. The data are presented as total cpm incorporated; bar indicates SEM. Background incorporation of [3H]thymidine in nonstimulated cultures was 400–2,700 cpm.

Similar articles

Cited by

References

    1. Hardy RR, Hayakawa K. B-lineage differentiation stages resolved by multiparameter flow cytometry. Ann NY Acad Sci. 1995;764:19–24. - PubMed
    1. Rolink A, Melchers F. B-cell development in the mouse. Immunol Lett. 1996;54:157–161. - PubMed
    1. Loffert A, Schaal S, Ehlich A, Hardy RR, Zou Y-R, Muller W, Rajewsky K. Early B-cell development in the mouse: insights from mutations introduced by gene targeting. Immunol Rev. 1994;137:135–154. - PubMed
    1. Nussenzweig MC, Shaw AC, Sinn E, Danner DB, Holmes KL, Morse HC, III, Leder P. Allelic exclusion in transgenic mice that express the membrane form of immunoglobulin μ. Science. 1987;236:816–819. - PubMed
    1. Hartley SB, Cooke MP, Fulcher DA, Harris AW, Cory S, Basten A, Goodnow CC. Elimination of self-reactive B lymphocytes proceeds in two stages: arrested development and cell death. Cell. 1993;72:325–335. - PubMed

Substances