. 1998 Aug;112(2):145-60.
doi: 10.1085/jgp.112.2.145.

Regulatory volume decrease and intracellular Ca2+ in murine neuroblastoma cells studied with fluorescent probes

Affiliations

Regulatory volume decrease and intracellular Ca2+ in murine neuroblastoma cells studied with fluorescent probes

J Altamirano et al. J Gen Physiol. 1998 Aug.

Abstract

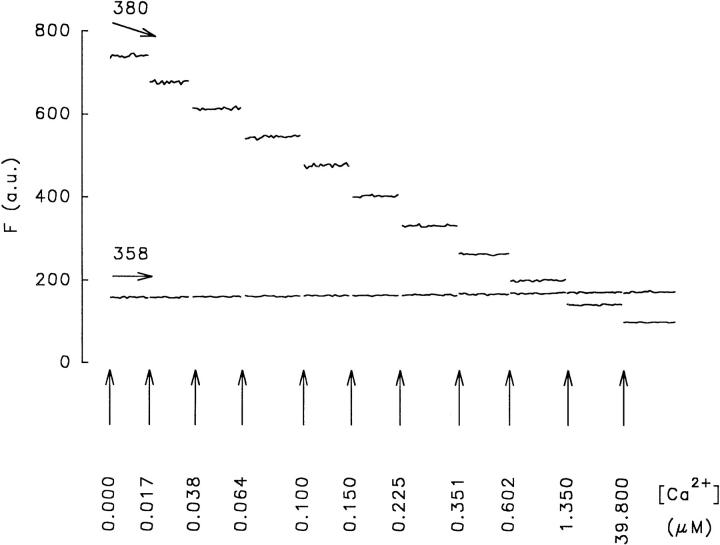
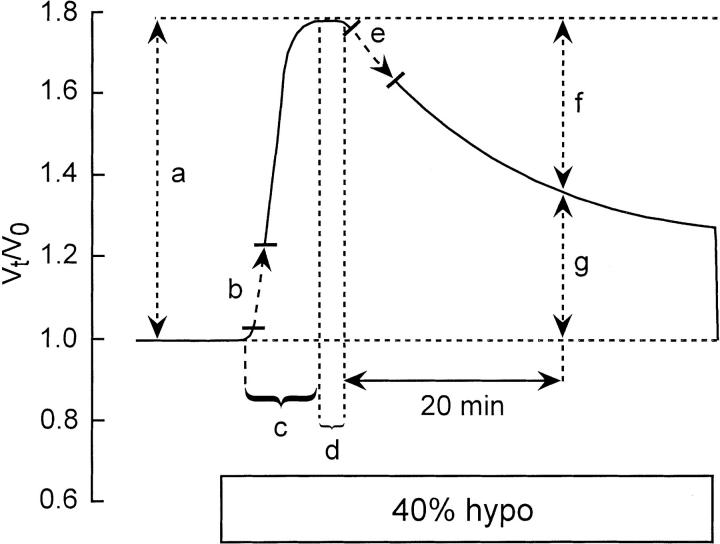
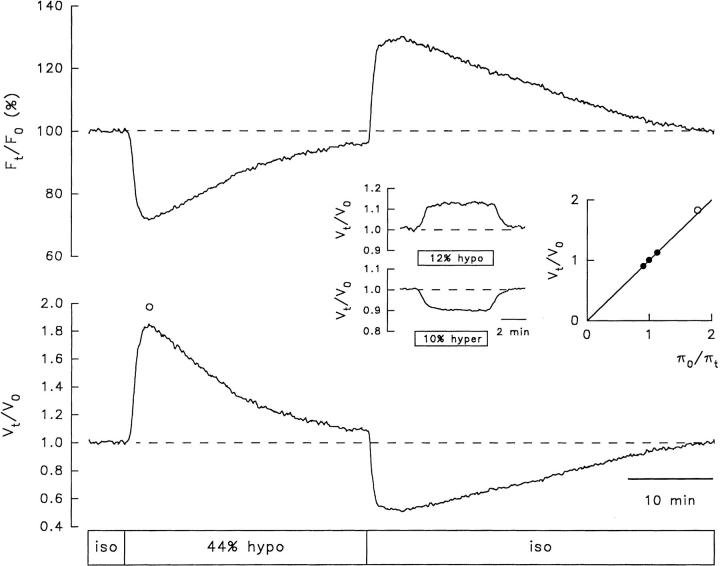
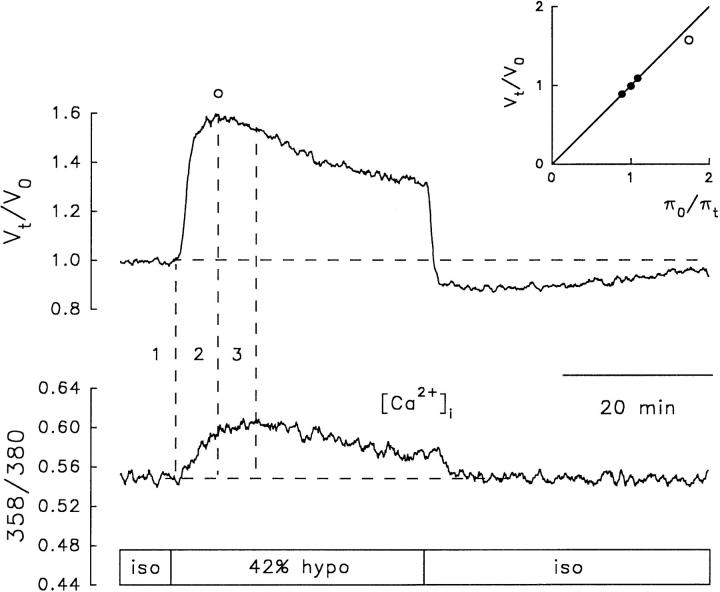
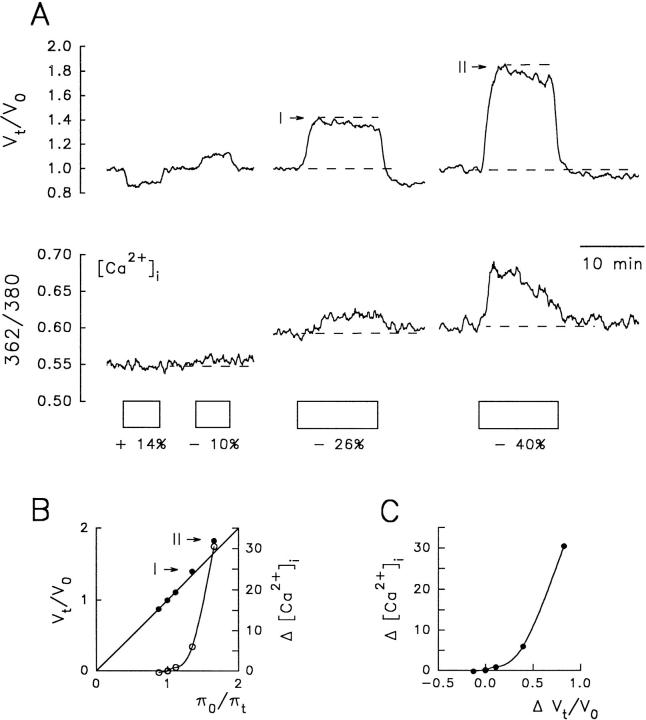
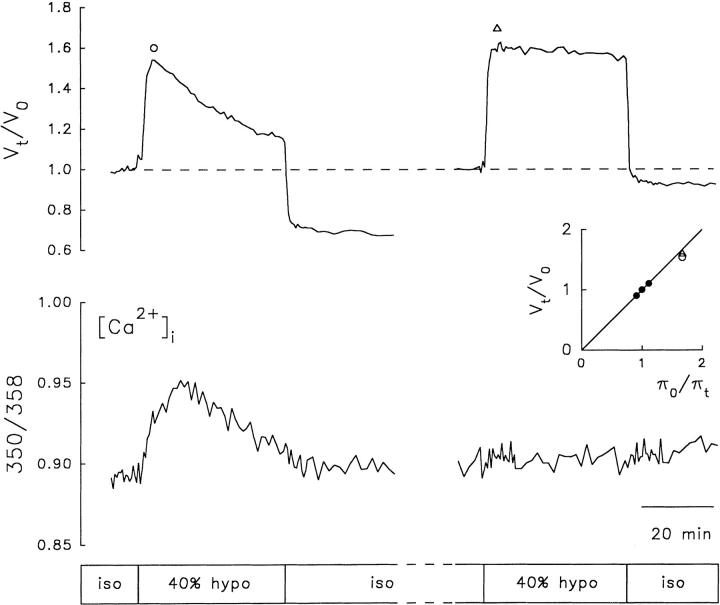
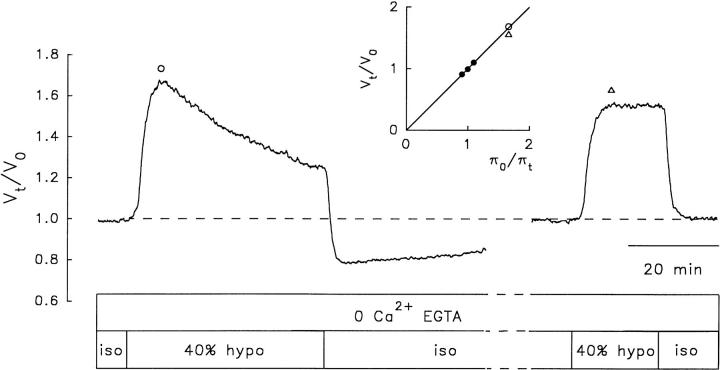
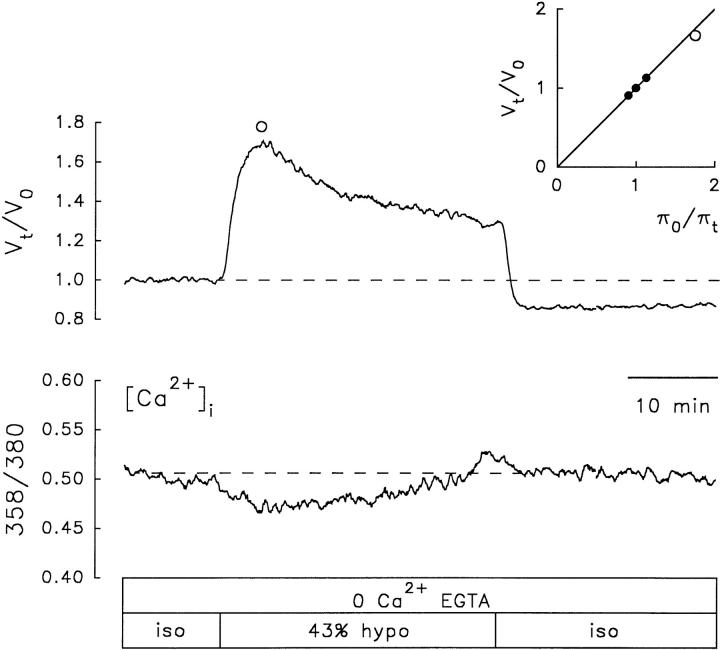
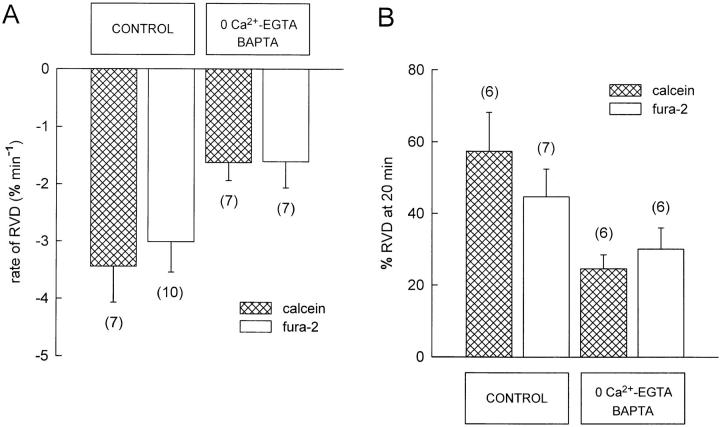
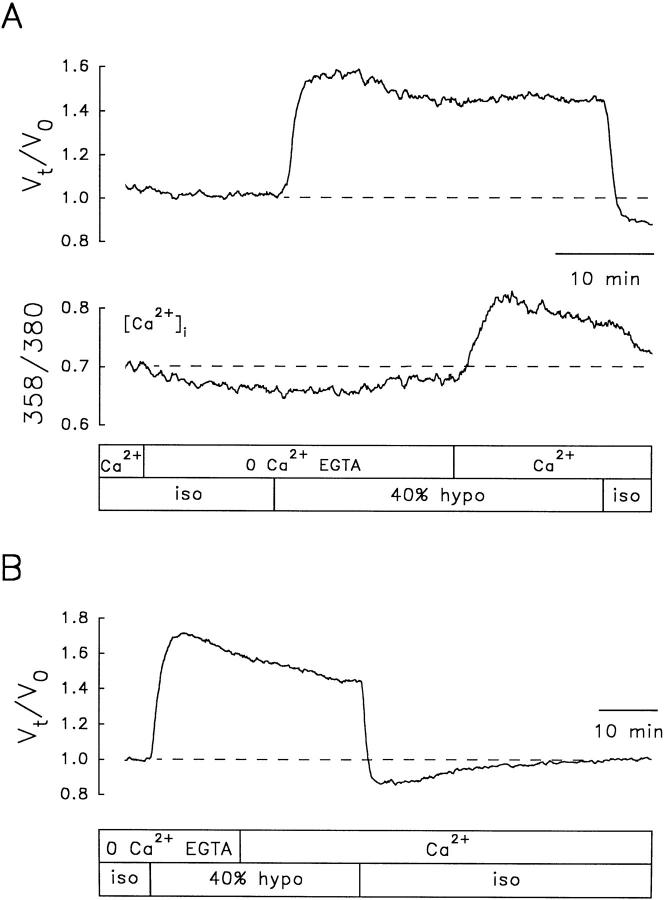
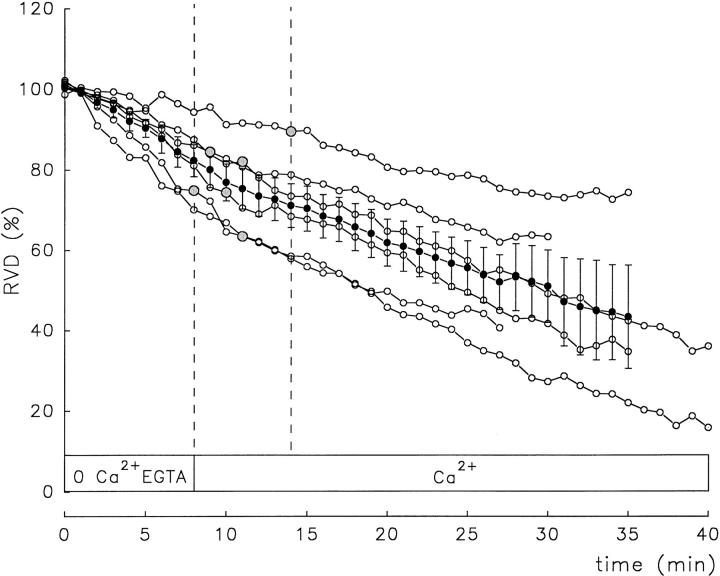
The possible role of Ca2+ as a second messenger mediating regulatory volume decrease (RVD) in osmotically swollen cells was investigated in murine neural cell lines (N1E-115 and NG108-15) by means of novel microspectrofluorimetric techniques that allow simultaneous measurement of changes in cell water volume and [Ca2+]i in single cells loaded with fura-2. [Ca2+]i was measured ratiometrically, whereas the volume change was determined at the intracellular isosbestic wavelength (358 nm). Independent volume measurements were done using calcein, a fluorescent probe insensitive to intracellular ions. When challenged with approximately 40% hyposmotic solutions, the cells expanded osmometrically and then underwent RVD. Concomitant with the volume response, there was a transient increase in [Ca2+]i, whose onset preceded RVD. For hyposmotic solutions (up to approximately -40%), [Ca2+]i increased steeply with the reciprocal of the external osmotic pressure and with the cell volume. Chelation of external and internal Ca2+, with EGTA and 1,2-bis-(o -aminophenoxy) ethane-N,N,N ',N '-tetraacetic acid (BAPTA), respectively, attenuated but did not prevent RVD. This Ca2+-independent RVD proceeded even when there was a concomitant decrease in [Ca2+]i below resting levels. Similar results were obtained in cells loaded with calcein. For cells not treated with BAPTA, restoration of external Ca2+ during the relaxation of RVD elicited by Ca2+-free hyposmotic solutions produced an increase in [Ca2+]i without affecting the rate or extent of the responses. RVD and the increase in [Ca2+]i were blocked or attenuated upon the second of two approximately 40% hyposmotic challenges applied at an interval of 30-60 min. The inactivation persisted in Ca2+-free solutions. Hence, our simultaneous measurements of intracellular Ca2+ and volume in single neuroblastoma cells directly demonstrate that an increase in intracellular Ca2+ is not necessary for triggering RVD or its inactivation. The attenuation of RVD after Ca2+ chelation could occur through secondary effects or could indicate that Ca2+ is required for optimal RVD responses.


Figures

Figure 1
Figure 1
Common mode of rejection test. Fura-2 fluorescence recorded in the experimental bath chamber in response to a series of 0–10 mM calcium-EGTA buffer solutions, using a fluor 40×/1.3 oil-immersion objective. F, fluorescence in arbitrary units (a.u.). The free [Ca2+] (micromolar) is indicated by vertical arrows. Fura-2 was excited at 358 and 380 nm. Emission was measured at 510 nm. Note that at 358 nm, the isosbestic wavelength, the dye does not respond to Ca2+.
Figure 2
Figure 2
Schematic drawing illustrating measured variables of osmotic swelling and RVD responses elicited by a 40% hyposmotic challenge. Ordinate: relative cell volume (Vt/Vo). Abscissa: time. (a) Maximum (peak) swelling, (b) initial rate of swelling, (c) time to peak swelling, (d) RVD delay, (e) initial rate of RVD, (f  ) extent of RVD at t = 20 min, and (g) regulated relative cell volume at t = 20 min.
Figure 3
Figure 3
RVD monitored in a calcein-loaded NG108-15 cell in response to a 44% hyposmotic challenge. (top) Percent change in relative fluorescence (Ft/Fo). (bottom) Relative cell water volume changes (Vt/Vo) computed using Eq. 1. The box indicates the time of application of isosmotic (iso) and hyposmotic (hypo) solutions. The cell swelled to a maximum (83% of its initial volume) and then underwent RVD. Maximal volume recovery (87%) was achieved 22.7 min after RVD onset. As expected, upon returning to the isosmotic solution, the cell shrank and eventually recovered its initial volume. (inset) V t/V o in response to calibration test anisosmotic solutions having nominal osmolalities of ±10% with respect to the isosmotic solution (actual osmolalities were −12 and +10%). Steady state V t/V o changes in response to the test solutions are plotted against the reciprocal of the relative osmotic pressure of the medium (πot) for the calibration pulses (•). The peak V t/V o produced by the 44% hyposmotic solution is also plotted (○). The solid line denotes the theoretical behavior of a perfect osmometer according to Eq. 3. This kind of plot was made for all cells and is shown in subsequent figures.
Figure 4
Figure 4
Relative volume changes (Vt/Vo) and [Ca2+]i recorded simultaneously in response to a 42% hyposmotic challenge in a fura-2-loaded NG108-15 cell. (top) V t/V o obtained from changes in fluorescence measured at 358-nm excitation wavelength, the isosbestic point for fura-2. (bottom) Changes in [Ca2+]i measured as the ratio 358/380. Dashed vertical lines are traced at the onset (1) and peak (2) of the volume response, and at the peak of the intracellular Ca2+ signal (3). (inset) Calibration plot obtained as explained in Fig. 3.
Figure 5
Figure 5
Relationship between external osmolality, [Ca2+]i, and relative cell volume (Vt/Vo) in a fura-2-loaded NG108-15 cell. (A) Changes in V t/V o and [Ca2+]i (measured as the ratio 362/380) in response to anisosmotic solutions. The percent osmolalities of each solution relative to the isosmotic control are indicated at the bottom of each box. Note that the rate of RVD (I and II  ) increased together with [Ca2+]i and cell volume. (B) Estimated changes in [Ca2+]i, nanomoles (○), and V t/V o (•) plotted as a function of the reciprocal of the relative osmotic pressure of the medium (πot). (C ) Estimated changes in [Ca2+]i (nanomoles) as a function of V t/V o.
Figure 6
Figure 6
Inactivation of RVD response upon repeated hyposmotic challenges. Changes in relative cell volume (Vt/Vo) and [Ca2+]i in response to two identical hyposmotic challenges in a fura-2-loaded N1E-115 cell. The cell was exposed to two 40% hyposmotic challenges, each lasting ∼40 min applied with an interval of 55 min. (top) V t/V o. (bottom) Changes in [Ca2+]i. (inset) Calibration plot obtained as explained in Fig. 3. (○) Peak amplitude of the first pulse, and (▵) peak amplitude of the second pulse. Boxes indicate the time of application of isosmotic (iso) and hyposmotic (hypo) solutions.
Figure 7
Figure 7
Inactivation of RVD response upon repeated hyposmotic challenges in the virtual absence of external Ca2+. Changes in relative cell volume (V t/V o) in response to two hyposmotic challenges of identical osmolality, in a single NG108-15 cell loaded with calcein. Except for the calibration test solutions, the isosmotic and hyposmotic solutions were Ca2+-free and contained 0.5 mM EGTA. After testing the anisosmotic calibration pulses, the cell was superfused with a Ca2+-free isosmotic solution for 10 min before the first Ca2+-free 40% hyposmotic challenge. The second Ca2+-free hyposmotic challenge was applied 44 min after the end of the first one. During the interval between hyposmotic challenges, the cell was superfused with Ca2+-free isosmotic solution. The inset shows a calibration plot obtained as explained in Fig. 3. (○) Peak amplitude of the first pulse, and (▵) peak amplitude of the second pulse. Boxes indicate the time of application of isosmotic (iso) and hyposmotic (hypo) solutions.
Figure 8
Figure 8
Effect of extracellular and intracellular Ca2+ chelation on RVD and [Ca2+]i. RVD elicited by a 43% hyposmotic solution, under external and internal Ca2+ chelation, in a fura-2-loaded NG108-15 cell. The cell was incubated with BAPTA/AM (100 μM) for 2 h and kept in a Ca2+-free isosmotic solution containing EGTA (0.5 mM) for 11 min before the Ca2+-free 43% hyposmotic challenge. Note that the apparent [Ca2+]i, measured as the ratio 358/ 380, decreases upon exposure to the hyposmotic solution but the RVD response persists.
Figure 9
Figure 9
Effect of extracellular and intracellular Ca2+ chelation on the rate (A) and extent (B) of RVD in cells loaded with calcein or fura-2. The initial rate of RVD (percent at min−1) and the extent of RVD (percent RVD at 20 min) were measured as described in Fig. 2. There is a significant difference in the initial average rate of RVD (A), between control and Ca2+-chelated (0 Ca2+-EGTA/BAPTA) conditions in both calcein-loaded (P < 0.01) and fura-2-loaded cells (P < 0.05). There is a significant difference (P < 0.01) in the extent of RVD (B), between control and Ca2+-chelated (0 Ca2+-EGTA/ BAPTA) conditions in calcein-loaded cells, but not in fura-2-loaded cells.
Figure 10
Figure 10
Restoration of extracellular Ca2+ during RVD elicited by a 0 Ca2+-EGTA hyposmotic solution. (A) NG108-15 cell loaded with fura-2. (top) V t/V o, (bottom) apparent [Ca2+]i, measured as the ratio 358/380. (B) NG108-15 cell loaded with calcein. The cells were superfused with a Ca2+-free isosmotic solution containing 0.5 mM EGTA (0 Ca2+ EGTA) for at least 10 min before applying the 0 Ca2+-EGTA–40% hyposmotic challenge. External Ca2+ (2.5 mM) was restored at the time indicated by the boxes. Restoration of external Ca2+ did not increase the slope of RVD, although this maneuver did produce a transient increase in [Ca2+]i, shown in the fura-2-loaded cell (A, bottom).
Figure 11
Figure 11
Lack of effect of extracellular Ca2+ restoration during RVD responses elicited by 0 Ca2+-EGTA hyposmotic solutions. The same experimental protocol was shown in Fig. 10. Ordinate, percent RVD. Abscissa, time. (○) Individual NG108-15 cells. (•) Mean ± SEM RVD response recorded in six cells. External Ca2+ was restored at the interval delimited by the parallel dashed lines. The time at which external Ca2+ was restored in each individual cell is signaled by larger shaded circles.

Similar articles

Cited by

References

    1. Adorante JS, Cala PM. Mechanisms of regulatory volume decrease in nonpigmented human ciliary epithelial cell. Am J Physiol. 1995;268:C721–C731. - PubMed
    1. Altamirano J, Brodwick MS, Alvarez-Leefmans FJ. Regulatory volume decrease is independent of internal calcium changes in N1E115 and NG108 cells. Biophys J. 1996;70:A413. . (Abstr.)
    1. Alvarez-Leefmans FJ, Gamiño SM, Reuss L. Cell volume changes upon sodium pump inhibition in Helix aspersaneurones. J Physiol (Camb) 1992;458:603–619. - PMC - PubMed
    1. Alvarez-Leefmans FJ, Altamirano J, Crowe WE. Use of ion-selective microelectrodes and fluorescent probes to measure cell volume. Methods Neurosci. 1995;27:361–391.
    1. Amano T, Richelson E, Nirenberg M. Neurotransmitter synthesis by neuroblastoma clones. Proc Natl Acad Sci USA. 1972;69:258–263. - PMC - PubMed

Publication types

MeSH terms