. 1998 Aug;112(2):161-79.
doi: 10.1085/jgp.112.2.161.

Effect of sarcoplasmic reticulum (SR) calcium content on SR calcium release elicited by small voltage-clamp depolarizations in frog cut skeletal muscle fibers equilibrated with 20 mM EGTA

Affiliations

Effect of sarcoplasmic reticulum (SR) calcium content on SR calcium release elicited by small voltage-clamp depolarizations in frog cut skeletal muscle fibers equilibrated with 20 mM EGTA

P C Pape et al. J Gen Physiol. 1998 Aug.

Erratum in

  • J Gen Physiol 1998 Nov;112(5):649

Abstract

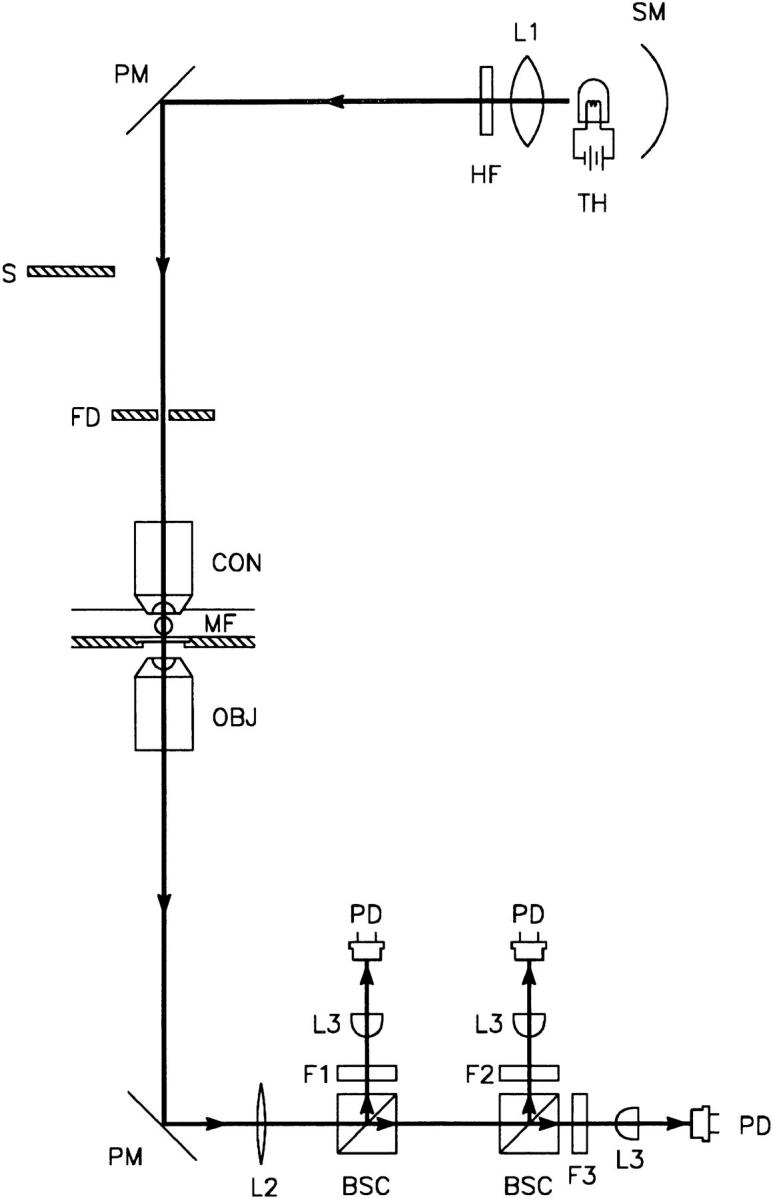
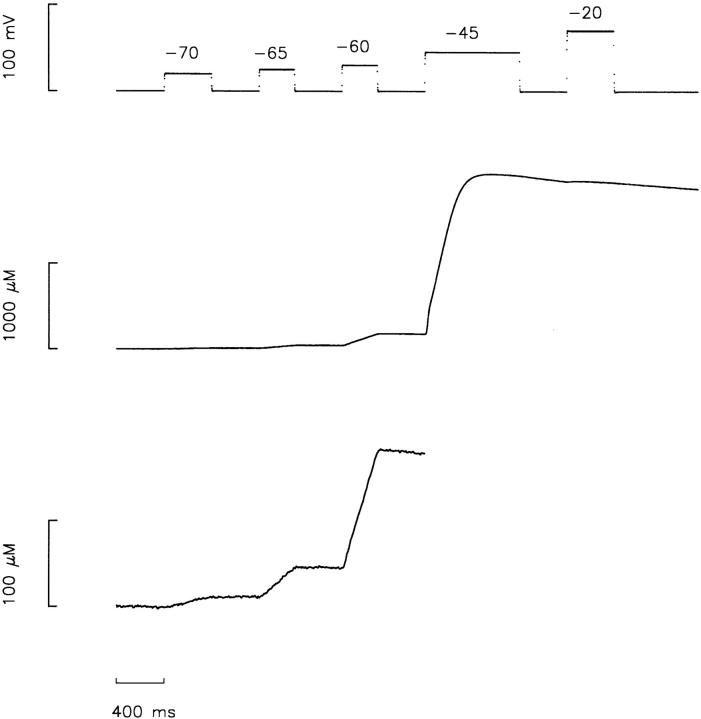
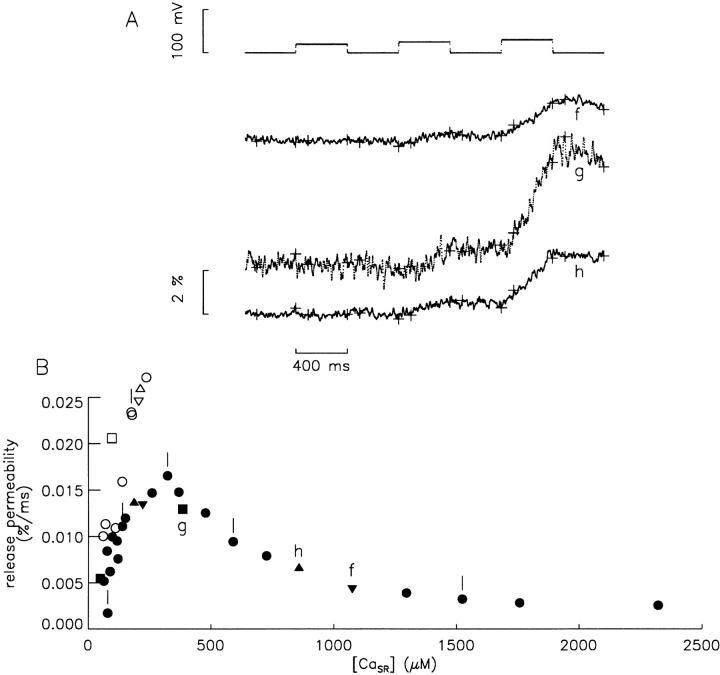
Cut muscle fibers from Rana temporaria (sarcomere length, 3.5-3.9 micro(m); 14-16 degreesC) were mounted in a double Vaseline-gap chamber and equilibrated with an external solution that contained tetraethyl ammonium- gluconate and an internal solution that contained Cs as the principal cation, 20 mM EGTA, and 0 Ca. Fibers were stimulated with a voltage-clamp pulse protocol that consisted of pulses to -70, -65, -60, -45, and -20 mV, each separated by 400-ms periods at -90 mV. The change in total Ca that entered into the myoplasm (Delta[CaT]) and the Ca content of the SR ([CaSR]) were estimated with the EGTA/phenol red method (Pape, P.C., D.-S. Jong, and W.K. Chandler. 1995. J. Gen. Physiol. 106:259-336). Fibers were stimulated with the pulse protocol, usually every 5 min, so that the resting value of [CaSR] decreased from its initial value of 1,700-2, 300 microM to values near or below 100 microM after 18-30 stimulations. Three main findings for the voltage pulses to -70, -65, and -60 mV are: (a) the depletion-corrected rate of Ca release (release permeability) showed little change when [CaSR] decreased from its highest level (>1,700 microM) to approximately 1,000 microM; (b) as [CaSR] decreased below 1,000 microM, the release permeability increased to a maximum level when [CaSR] was near 300 microM that was on average about sevenfold larger than the values observed for [CaSR] > 1,000 microM; and (c) as [CaSR] decreased from approximately 300 microM to <100 microM, the release permeability decreased, reaching half its maximum value when [CaSR] was approximately 110 microM on average. It was concluded that finding b was likely due to a decrease in Ca inactivation, while finding c was likely due to a decrease in Ca-induced Ca release.


Figures

Figure 1
Figure 1
Schematic diagram of the optical apparatus used to simultaneously measure the intensities of transmitted light at three different wavelengths. SM, spherical mirror; TH, 100-W tungsten-halogen lamp powered by a regulated constant-current power supply (PAD16-18L; Kikusui Electronics Corp., Tokyo, Japan); L1, collecting lens; HF, heat filter; PM, plane mirror; S, computer-controlled shutter for limiting light exposed to muscle fiber; FD, field diaphragm for illuminating the fiber with a spot of light; CON, water immersion condenser objective (ICS Acroplan infinity-corrected objective, magnification 20×, with aperture stop to give NA 0.4; Carl Zeiss, Inc., Thornwood, NY) for focusing light onto the fiber; MF, muscle fiber in experimental chamber with a 0.16–0.19-mm glass coverslip at the bottom; OBJ, objective (LD Acroplan infinity-corrected objective, magnification 32×, NA 0.4; Carl Zeiss, Inc.) for collecting light from muscle fiber; PM, plane mirror in microscope that sends 100% of the light from OBJ to the side port; L2, lens (KPX115 plano-convex lens, F 400 mm; Newport Corp., Irvine, CA) for producing an approximately parallel beam; BSC, beam-splitting cube (Melles Griot, Irvine, CA) for splitting the light into two beams of equal intensity; F1, F2, and F3, three filters for selecting the wavelengths; L3, lens to focus light onto PD, a photodiode (UV-100B, EG&G, Electro-optics Div., Salem, MA).
Figure 2
Figure 2
Illustration of stimulation protocol. The top trace shows the voltage measured in end pool 1. Given in order of application, pulses to −70, −65, −60, −45, and −20 mV had durations, respectively, of 400, 300, 300, 800, and 400 ms. The duration of the periods at −90 mV at the start and between the pulses were all 400 ms. Except where noted, this stimulation protocol was essentially the only one used during all of the experiments described in this article. The middle trace shows the Δ[CaT] trace measured with the EGTA-phenol red method. The maximum level of the trace is taken to be [CaSR]R. The bottom trace shows the same Δ[CaT] trace plotted with an expanded vertical axis; points after the start of the pulse to −45 mV are not shown. Fiber reference 510971; time after saponin treatment, 76 min; sarcomere length, 3.7 μm; fiber diameter, 107 μm; holding current, −37 nA; 14.5°C; concentration of phenol red at optical site, 1.65 mM; [CaSR]R, 2,043 μM; estimated pHR and free [Ca]R, 6.806 and 0.088 μM, respectively; interval of time between data points, 0.96 ms.
Figure 3
Figure 3
Time course of [CaSR]R plotted against time after saponin treatment of the fiber segments in the end pools. At 16 min, 0.8 mM phenol red was introduced into the end pools. The end-pool solution containing 1.76 mM Ca was present from the time of saponin treatment until 80 min, at which point Ca was removed from the end pools. The period in the 0-Ca solution is indicated by filled symbols and by the line labeled 0 Ca. At 203 min, 1.76 mM Ca was reintroduced into the end pools. The period of time between points was usually 5 min. The period of time was reduced to ∼1 min between the upside down triangle and the following square, and increased back to 5 min between the square and the following triangle. Point a was determined from the middle trace shown in Fig. 2. a–e correspond to traces shown in Fig. 4. Range of values from beginning to end of experiment: fiber diameter, 106– 111 μm; holding current, −37 to −128 nA; concentration of phenol red at optical site, 1.40–3.03 mM; estimated pHR, 6.802–6.707.
Figure 4
Figure 4
Voltage and Ca signals at different times. (A) The top trace shows voltage. The bottom traces show the five Δ[CaT] signals corresponding to Fig. 3, a–e. In a, points after just before starting the pulse to −45 mV are not shown. [CaSR]R values for a–e, respectively, were 2,043, 1,029, 267, 99, and 347 μM. (B, top) Same voltage trace as in A up to the start of the pulse to −45 mV. The bottom traces show 100 · ln{[CaSR]R/([CaSR]R − Δ[CaT])} determined from the Δ[CaT] signals in A (see text for explanation). A release permeability value for a given voltage was determined from the slope of the best-fit line to points during the pulse minus the average of the slopes of the lines during the periods at −90 mV on either side of the pulse. The points used in the fits are shown by the cross symbols; in every case, the first point used in the fit was 100 ms from the start of the interval and the last point was the last point of the interval.
Figure 9
Figure 9
Release permeability signals at −60 mV during an experiment. In A and B, the top trace shows voltage and the bottom traces show release permeability signals. (A) The five bottom traces show, in chronological order from top to bottom, the release permeability signals obtained at different [CaSR]R values, 2,043, 1,029, 562, 267, 150, and 99 μM. The release permeabilities from top to bottom were 0.025, 0.028, 0.073, 0.115, 0.074, and 0.035%/ms. The cursors show the points during the pulse used in the estimate of the release permeability and the line shows the average of the points in these signals. a–d corresponded to the similarly labeled points or traces in Figs. 3–5, 7, and 8. (B) The dotted release permeability traces (thicker lines) are the same traces shown at the same level in A, but plotted at a different gain. The trace plotted as a thin line in each pair is the same as c in A. The calibration bar applies to all of the release permeability traces. To reduce noise, the intrinsic absorbance signal was not subtracted from the ΔpH-sensitive absorbance signal in the bottom two traces in A and all of the release permeability traces were digitally filtered by an additional 0.01 kHz Gaussian filter.
Figure 5
Figure 5
Release permeability vs. [CaSR]. Values of release permeability (determined as described in Fig. 4) are plotted vs. [CaSR] for pulses to −60, −65, and −70 mV in A–C, respectively. A [CaSR] value is the average of [CaSR]R − Δ[CaT] for the points during the pulse that were used to determine the release permeability (see Fig. 4). The definitions of the symbols (open vs. closed, circles, upside-down triangles, triangles, and squares) are given in Fig. 3. Points a–e correspond to similarly labeled points in Fig. 3 and traces in Fig. 4.
Figure 7
Figure 7
Icm during the course of an experiment. In A–C, the top trace shows voltage and the bottom five traces show Icm signals determined for the same stimulations used for a–e in Fig. 3 and Fig. 5, and similarly labeled traces in Fig. 4. Points a–e shown on the right side of C apply to the five Icm traces in all three panels. A shows Icm for the full stimulation protocol. B and C show the OFF Icm for the pulses to −45 and −20 mV, respectively, on an expanded time scale. D shows −Q OFF plotted against time after saponin treatment for pulses to −60 (asterisks), −45 (open symbols), and −20 (filled symbols) mV. The definitions of the symbols (circles, upside-down triangles, triangles, and squares) are given in Fig. 3.
Figure 8
Figure 8
Voltage steepness of Ca release during the course of an experiment. (A) The release permeability plotted against voltage for the same stimulations used for a–e in Figs. 3–5, and 7. Points a–e correspond to points plotted, respectively, as +, ○, •, ▴, and □. Each line corresponds to the least-squares best fit to the points of an exponential function given by C · e(V/k). (B) Plot of the voltage-steepness factor (k) plotted vs. time after saponin treatment for all of the points during the experiment. The definition of the symbols is given in Fig. 3. Points a–e are from the best-fit functions shown in A.
Figure 6
Figure 6
Release permeability results from another experiment. (A, top) Voltage. The bottom traces show 100 · ln{[CaSR]R/ ([CaSR]R − Δ[CaT])} (see Fig. 4 B for more details). [CaSR]R values for traces f–h were, respectively, 1,087, 387, and 874 μM. (B) Values of release permeability are plotted vs. [CaSR] for pulses to −60 mV. Points f–h correspond to the similarly labeled traces in A. The vertical line segments mark points in which the chronological order of the first three pulses was −60, −65, −70 mV instead of the usual −70, −65, −60 mV. See Fig. 5 for more details about how the points were determined and the definitions of the symbols. Fiber reference 724972; sarcomere length, 3.9 μm; 14.5°C; interval of time between data points, 0.96 ms. Table II gives additional information about this experiment.

Similar articles

Cited by

References

    1. Adrian RH, Peres A. Charge movement and membrane capacity in frog muscle. J Physiol (Camb) 1979;289:83–97. - PMC - PubMed
    1. Armstrong CM, Bezanilla F, Horowicz P. Twitches in the presence of ethylene glycol-bis(β-aminoethylether)-N,N′-tetraacetic acid. Biochim Biophys Acta. 1972;267:605–608. - PubMed
    1. Baylor SM, Chandler WK, Marshall MW. Arzenazo III signals in singly dissected frog twitch fibers. J Physiol (Camb) 1979;287:23–24. - PubMed
    1. Baylor SM, Chandler WK, Marshall MW. Sarcoplasmic reticulum calcium release in frog skeletal muscle fibres estimated from arsenazo III calcium transients. J Physiol (Camb) 1983;334:625–666. - PMC - PubMed
    1. Baylor SM, Hollingworth S. Fura-2 calcium transients in frog skeletal muscle fibres. J Physiol (Camb) 1988;403:151–192. - PMC - PubMed

Publication types

MeSH terms