. 1998 Aug;112(2):199-210.
doi: 10.1085/jgp.112.2.199.

Muscarinic K+ channel in the heart. Modal regulation by G protein beta gamma subunits

Affiliations

Muscarinic K+ channel in the heart. Modal regulation by G protein beta gamma subunits

T T Ivanova-Nikolova et al. J Gen Physiol. 1998 Aug.

Abstract

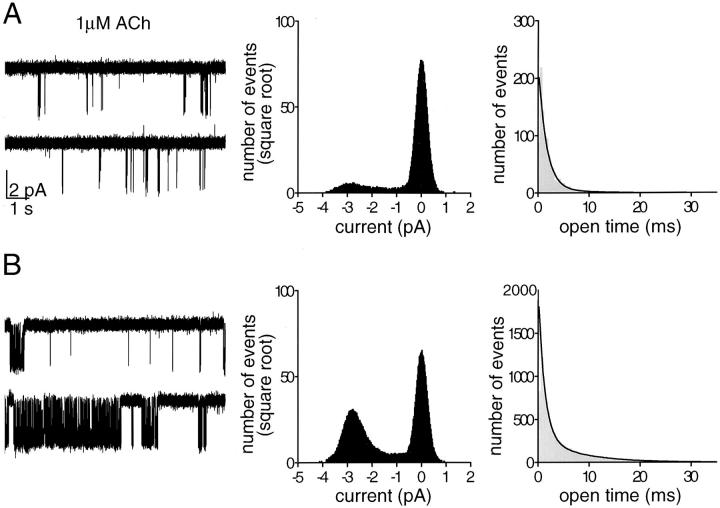
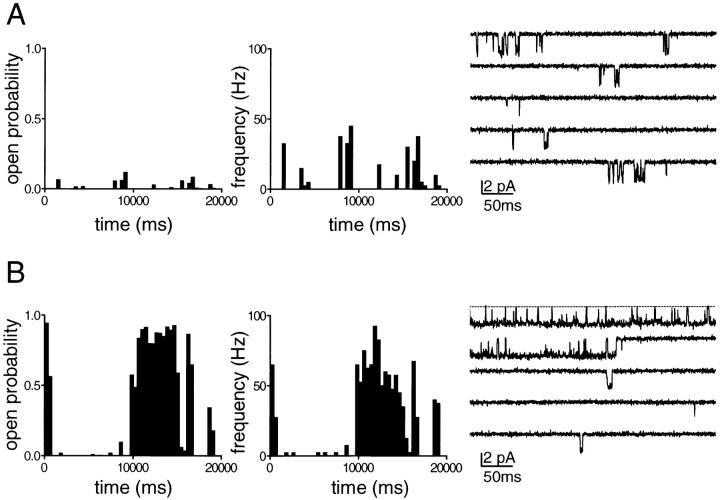
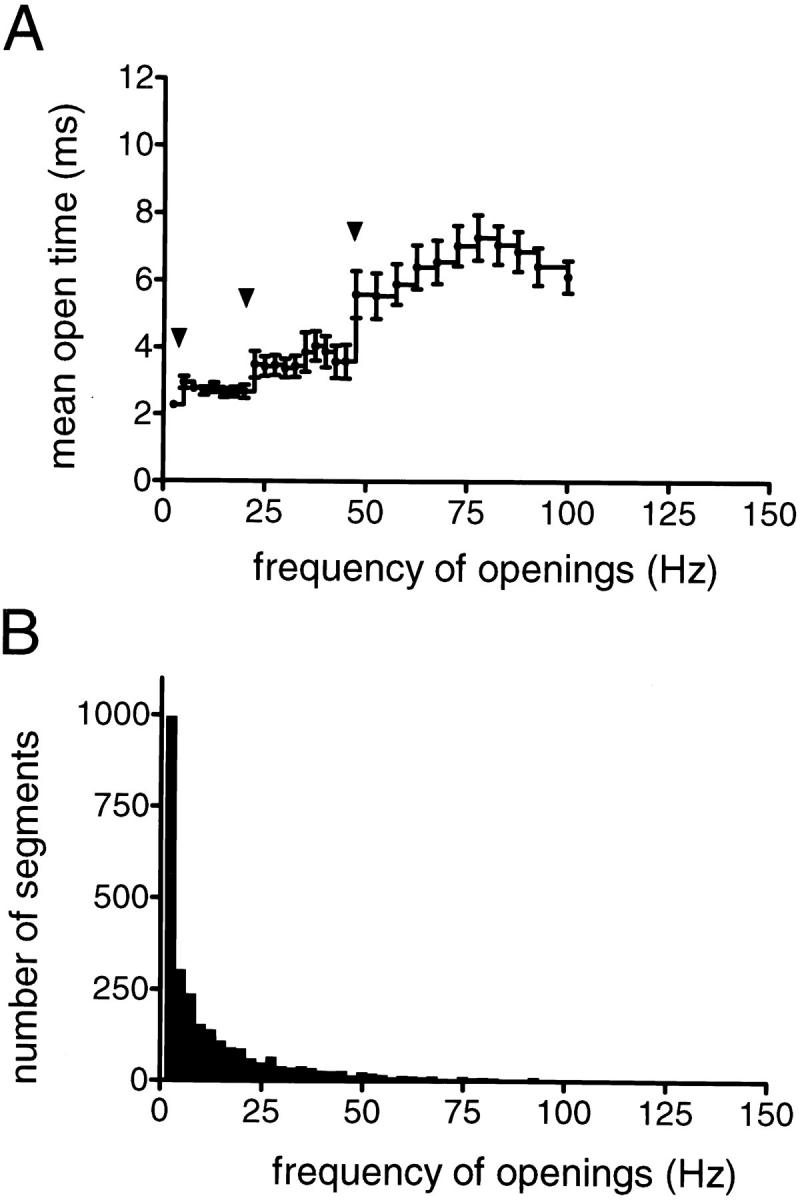
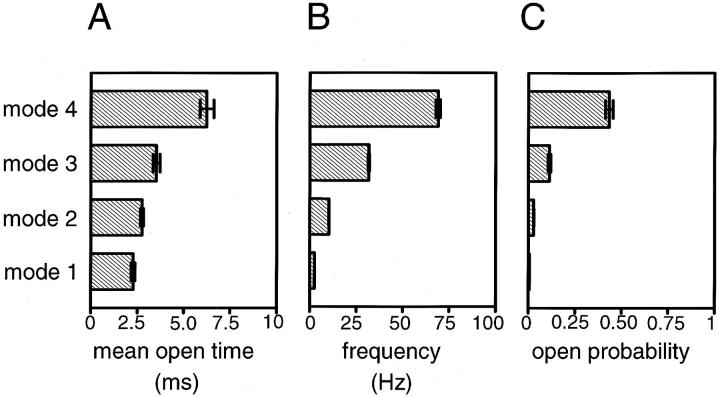
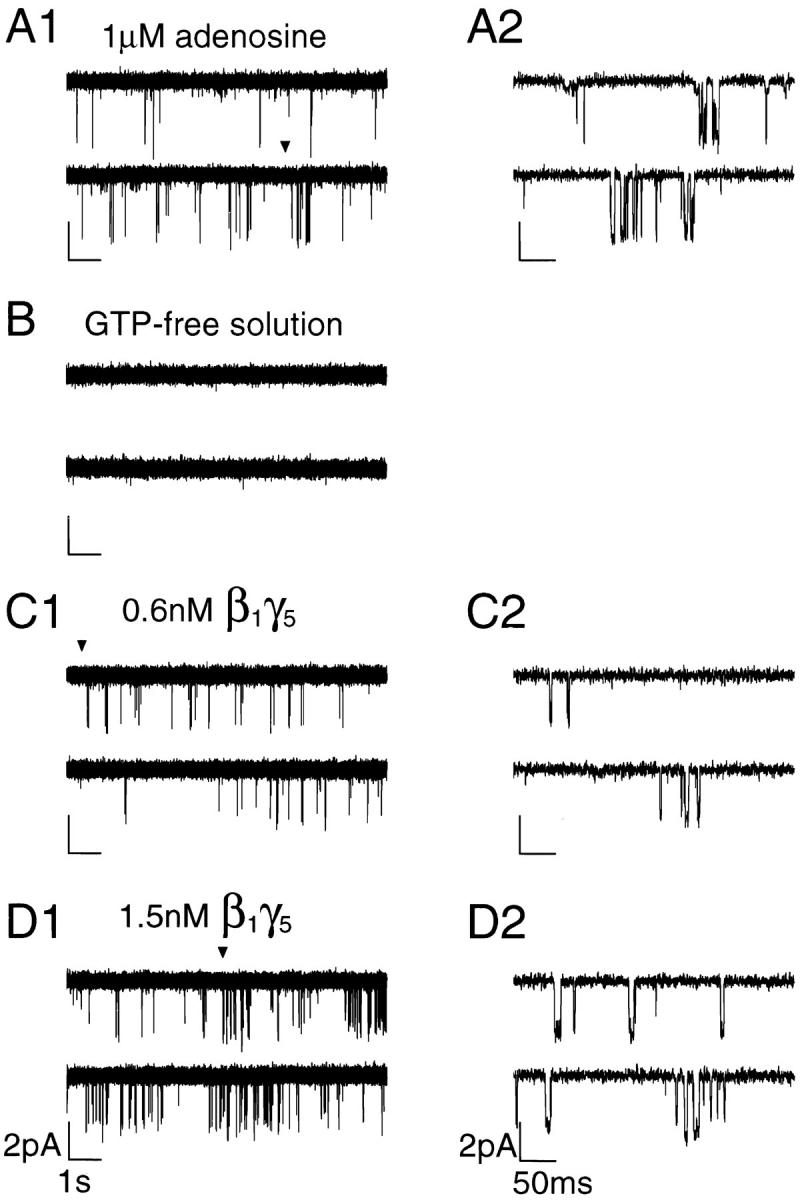
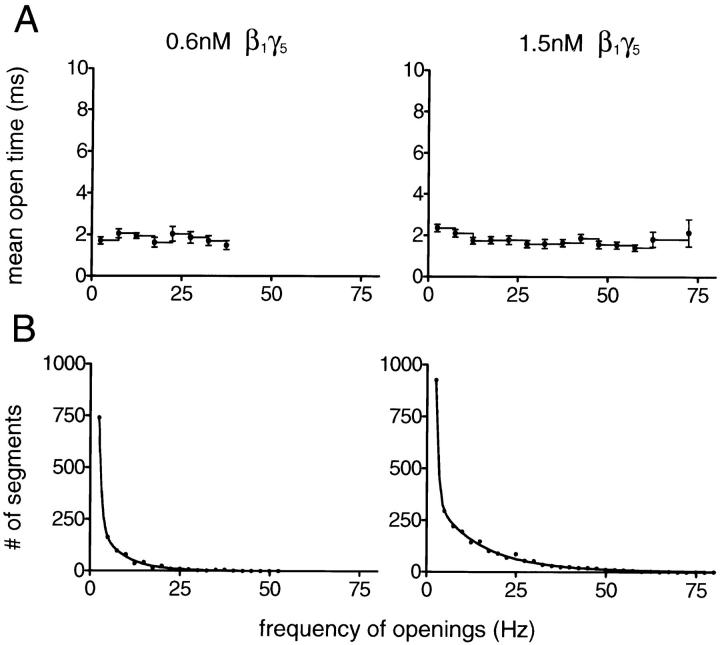
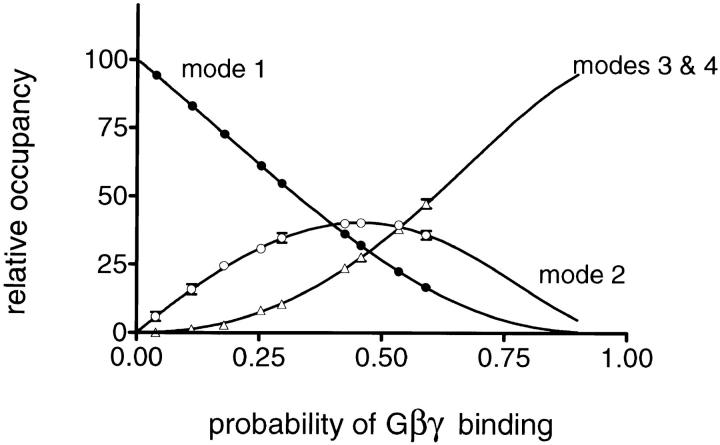
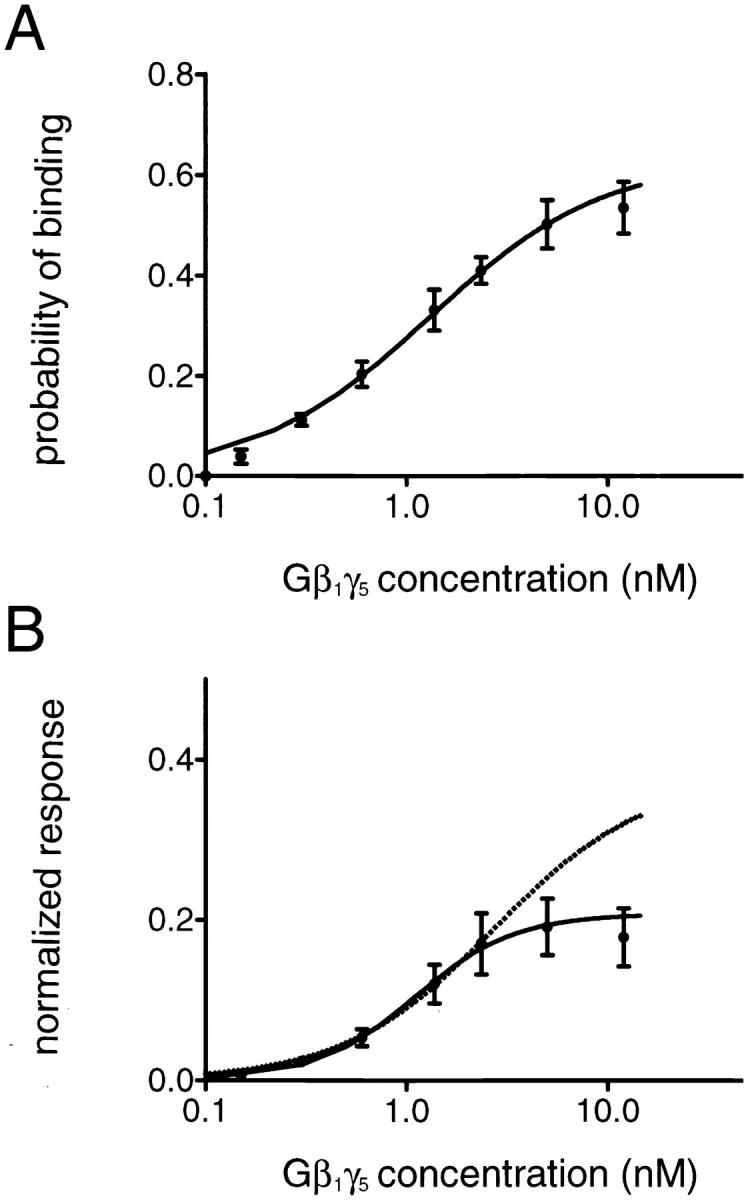
The membrane-delimited activation of muscarinic K+ channels by G protein beta gamma subunits plays a prominent role in the inhibitory synaptic transmission in the heart. These channels are thought to be heterotetramers comprised of two homologous subunits, GIRK1 and CIR, both members of the family of inwardly rectifying K+ channels. Here, we demonstrate that muscarinic K+ channels in neonatal rat atrial myocytes exhibit four distinct gating modes. In intact myocytes, after muscarinic receptor activation, the different gating modes were distinguished by differences in both the frequency of channel opening and the mean open time of the channel, which accounted for a 76-fold increase in channel open probability from mode 1 to mode 4. Because of the tetrameric architecture of the channel, the hypothesis that each of the four gating modes reflects binding of a different number of Gbeta gamma subunits to the channel was tested, using recombinant Gbeta1 gamma5. Gbeta1 gamma5 was able to control the equilibrium between the four gating modes of the channel in a manner consistent with binding of Gbeta gamma to four equivalent and independent sites in the protein complex. Surprisingly, however, Gbeta1 gamma5 lacked the ability to stabilize the long open state of the channel that is responsible for the augmentation of the mean open time in modes 3 and 4 after muscarinic receptor stimulation. The modal regulation of muscarinic K+ channel gating by Gbeta gamma provides the atrial cells with at least two major advantages: the ability to filter out small inputs from multiple membrane receptors and yet the ability to create the gradients of information necessary to control the heart rate with great precision.


Figures

Figure 1
Figure 1
Heterogeneity of KACh channel gating in neonatal rat atrial myocytes. Two examples of single-channel activity recorded from cell-attached patches in the presence of 1 μM ACh are shown in A and B to illustrate the kinetic heterogeneity of channel gating encountered in our experiments. The membrane potential of the patch was held at −90 mV in both cases. In this and all figures, the downward deflections correspond to inward currents. All-points and open-time histograms generated from the data shown in A and B are presented on the right. The all-points histograms were fitted by the sum of two Gaussian functions to determine the channel open probability, P o. The P o value obtained from the 20-s record is 0.013 in A and 0.297 in B. The open time distributions were fitted by the sum of two exponential components. The time constants of the fast and slow components are τo1 = 1.56 ms (83.6%) and τo2 = 7.50 ms (16.4%) in A and τo1 = 1.22 ms (52.1%) and τo2 = 7.54 ms (47.9%) in B. The time constants of the fast and slow components showed little variations from one experiment to another; however, the relative areas under the individual exponents were different.
Figure 2
Figure 2
Approach for classification of the KACh channel gating. Continuous single-channel recordings were divided into consecutive, 400-ms segments and the channel open probability and the frequency of openings were determined for each individual segment. Plots of open probability and frequency of gating vs. time, derived from the continuous KACh channel records illustrated in Fig. 1, are shown for comparison in A and B. Expanded current traces from each of the two records (illustrating the first five 400-ms segments in which KACh channel activity was present) are shown on the right to reveal the kinetic behavior of the channel in greater detail.
Figure 3
Figure 3
Segregation of KACh channel behavior into distinct gating modes. (A) The mean open time of the channel, t open, is plotted as a function of the frequency of channel openings, f. The t open value within each 400-ms data segment was calculated from the f and P o values within the same segment. The t open estimates were compiled from a total of 30 min of single-channel data recorded from 10 different cell-attached patches in the presence of 1 μM ACh, and the mean t open value for a particular f population was determined. For the frequencies above 47.5 Hz, where the number of data segments was relatively small, the mean t open value for each frequency, f, was averaged over a 5-Hz interval (f ± 2.5 Hz). The arrowheads in the t openf plot indicate the statistically significant augmentations in the mean t open value and presumably reflect the transitions from one pattern of KACh channel gating to another. (B) Histogram of frequencies of openings generated from the same set of data shown in A.
Figure 4
Figure 4
Properties of the four gating modes of the m2 receptor-activated KACh channel. Three different parameters: mean open time (A), frequency of channel openings (B), and mean open probability (C) were evaluated with regard to modal behavior of the channel after muscarinic receptor stimulation. The values for the mean open time of each gating mode are: t 1open = 2.28 ± 0.10, t 2open = 2.75 ± 0.08, t 3open = 3.53 ± 0.19, and t 4open = 6.24 ± 0.38 ms. The values for the frequency of channel openings are: f 1 = 2.5, f 2 = 10.3 ± 0.1, f 3 = 31.7 ± 0.3, and f 4 = 69.1 ± 1.2 Hz. The values for the mean open probability are: P o1 = 0.0057 ± 0.0003, P o2 = 0.0281 ± 0.0010, P o3 = 0.1128 ± 0.0065, and P o4 = 0.4341 ± 0.0195. Data are mean ± SEM (n = 231–1,116).
Figure 5
Figure 5
Activation of the KACh channels by recombinant Gβ1γ5. (A1) Representative single-channel activity recorded in cell-attached configuration from an atrial myocyte in the presence of 1 μM adenosine. The membrane potential was clamped at −90 mV. (A2) Part of the trace in A1 (arrowhead) has been expanded to show the transitions between the closed and open states of the channel with a higher resolution. (B) Channel activity disappeared after the patch excision in GTP-free solution. The membrane potential continued to be clamped at −90 mV for the entire experiment. (C–D) Application of nanomolar concentrations of Gβ1γ5 (0.6 nM in C1 and 1.5 nM in D1) restored the channel activity in a concentration- dependent manner. Extended current traces starting at the points indicated by the arrowheads in C1 and D1 are shown on the right in C2 and D2, respectively.
Figure 6
Figure 6
Modal classification of KACh channel gating in the presence of Gβ1γ5. (A) The t openf plots were generated from the analysis of the data illustrated in Fig. 5, C and D. In the presence of Gβ1γ5, the mean open time of the KACh channel was independent of the frequency of channel gating and approached the t open value estimated for gating mode 1 of receptor-activated channels. (B) Histograms of frequencies of openings are shown for the experiments illustrated in A. The histogram shown at left corresponds to Gβ1γ5 concentration of 0.6 nM, whereas the histogram shown at right corresponds to Gβ1γ5 concentration of 1.5 nM. Both histograms were fitted by the sum of three geometrics (Colquhoun and Hawkes, 1981): P(f) = a 1μ1 −1(1 − μ1 −1)f − 1 + a 2μ2 −1(1 − μ2 −1)f − 1 + a 3μ3 −1(1 − μ3 −1)f − 1 (continuous line). The mean frequency values and the relative areas of different components are μ1 = 1.4 Hz (73.2%), μ2 = 6.9 Hz (23.5%), and μ3 = 17.6 Hz (3.3%) at 0.6 nM Gβ1γ5; and μ1 = 1.3 Hz (54.9%), μ2 = 12.6 Hz (35.5%), and μ3 = 37.0 Hz (9.6%) at 1.5 nM Gβ1γ5. The proportion of high frequency data segments consistently increased with Gβ1γ5 concentration.
Figure 7
Figure 7
Modal equilibrium of Gβ1γ5-activated KACh channels. For each individual Gβ1γ5 experiment, the relative occupancy of different gating modes was estimated from the fraction of the f histogram fit by the corresponding geometric component. In some f histograms, the components representing gating modes 3 and 4 were too small to be accurately distinguished from each other and, therefore, the sojourns of the channel to these modes are jointly represented. In each experiment, the probability of Gβ1γ5-binding, P, was calculated from the relative occupancy of mode 1, 𝔉1, according to the equation 𝔉1 = 4P(1 − P)3/[1 − (1 − P)4], as a standardization procedure. The solid lines represent the predicted occupancy of the different gating modes for a model assuming independent and equivalent binding of a different number of Gβγ subunits to four binding sites in the channel structure. The symbols and error bars are the mean values ± SEM of two to four separate experiments.
Figure 8
Figure 8
(A) Gβ1γ5 binding to the KACh channel. The probability of Gβ1γ5 binding, P, is plotted against Gβ1γ5 concentration. The points and error bars represent the mean ± SEM of three to five separate experiments. The solid line through the data represents the least-squares fit with a hyperbolic equation: P = P max[Gβγ]/ ([Gβγ]+ K d), with P max = 0.63 and K d = 1.29 nM. (B) Gβ1γ5-concentration dependence of the KACh channel activation. The steady state KACh channel open probability, P o, is normalized to the open probability of mode 4, P o4Gβγ, determined in each experiment, and the P o/P o4Gβγ ratio is plotted against Gβ1γ5 concentration. Symbols and bars are mean ± SEM of three to five separate experiments. The continuous line represents the least-squares fit with the Hill equation (Eq. 3) and yields a Hill coefficient of 1.73 and an apparent k d of 1.09 nM. The predicted P o/P o4Gβγ ratio for a KACh channel with four gating modes arising from the binding of a different number of Gβγ subunits to four binding sites in the channel structure (Eqs. 1 and 2) is plotted for comparison as a dotted line.

Similar articles

Cited by

References

    1. Alzheimer C, Schwindt PC, Crill WE. Modal gating of Na+ channels as a mechanism of persistent Na+current in pyramidal neurons from rat and cat sensorimotor cortex. J Neurosci. 1993;13:660–673. - PMC - PubMed
    1. Breitwieser GE, Szabo G. Uncoupling of cardiac muscarinic and β-adrenergic receptors from ion channels by a guanine nucleotide analogue. Nature. 1985;317:538–540. - PubMed
    1. Clapham DE, Neer EJ. New roles for G-protein βγ-dimers in transmembrane signalling. Nature. 1993;365:403–406. - PubMed
    1. Colquhoun D, Hawkes AG. On the stochastic properties of single ion channels. Proc R Soc Ser B. 1981;211:205–235. - PubMed
    1. Colquhoun, D., and A.G. Hawkes. 1983. The principles of the stochastic interpretation of ion-channel mechanisms. In Single Channel Recording. B. Sakmann and E. Neher, editors. Plenum Publishing Corp., New York. 135–175.

Publication types

MeSH terms