. 1998 Aug;112(2):223-42.
doi: 10.1085/jgp.112.2.223.

Voltage gating of Shaker K+ channels. The effect of temperature on ionic and gating currents

Affiliations

Voltage gating of Shaker K+ channels. The effect of temperature on ionic and gating currents

B M Rodríguez et al. J Gen Physiol. 1998 Aug.

Abstract

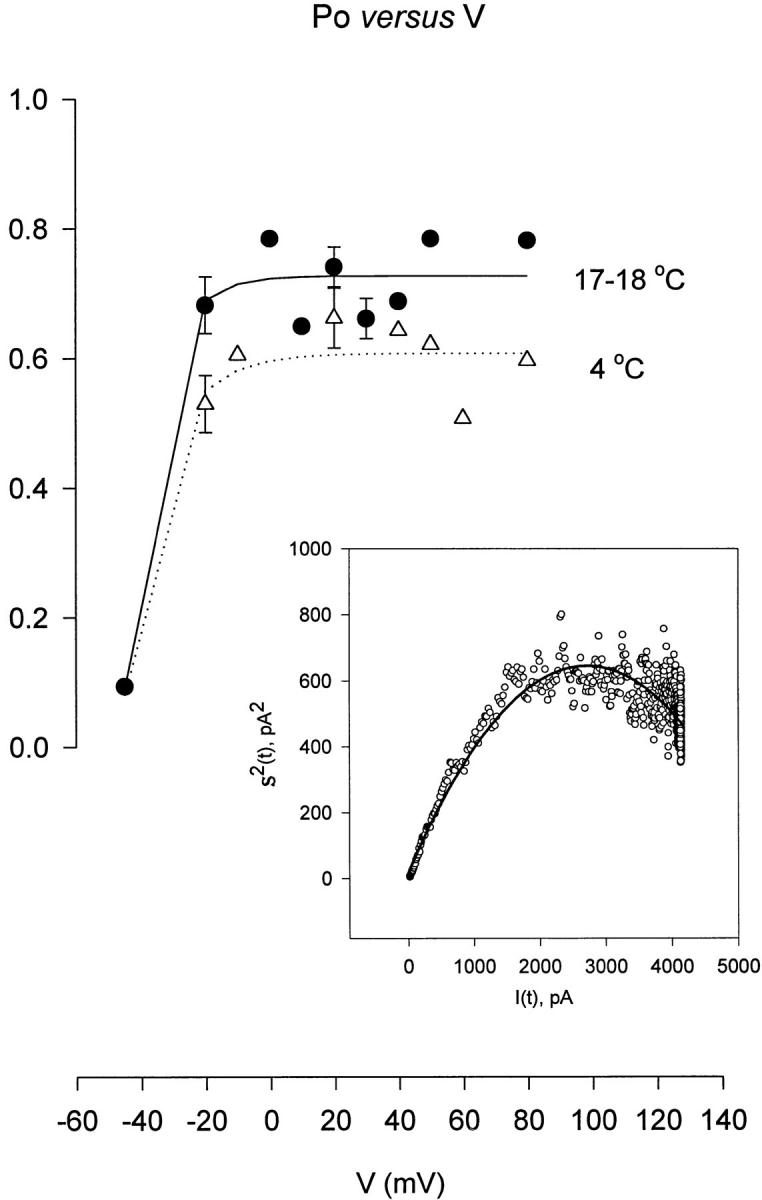
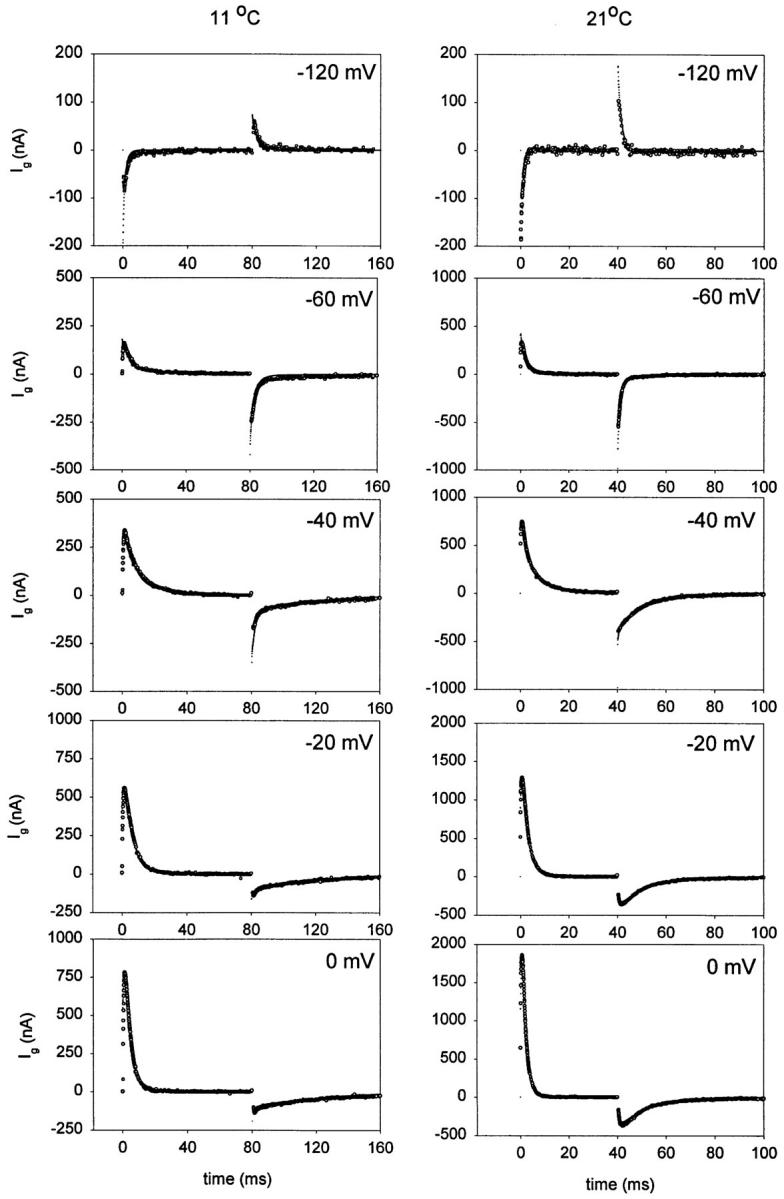
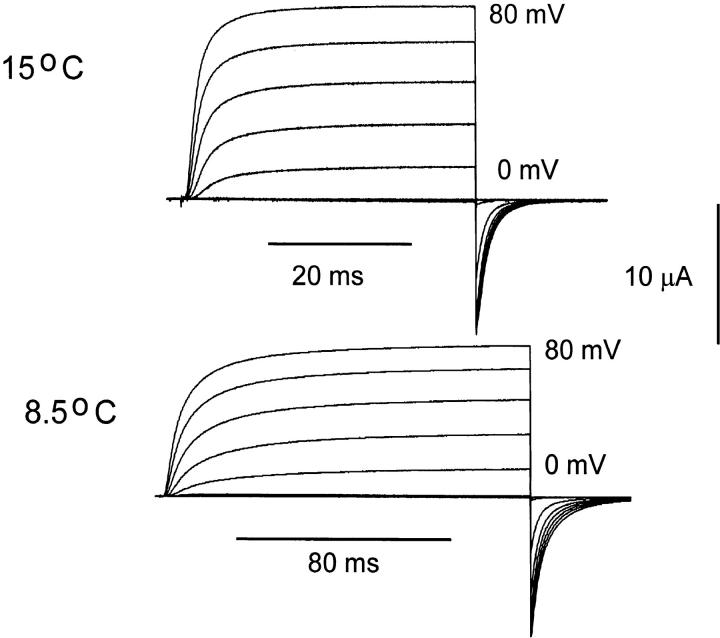
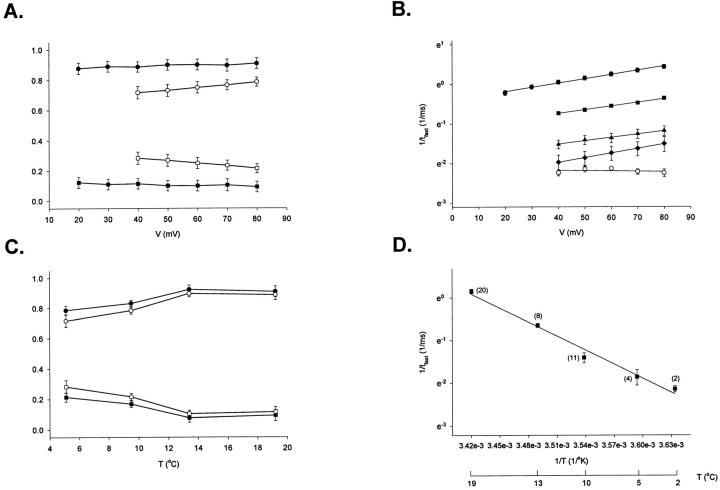
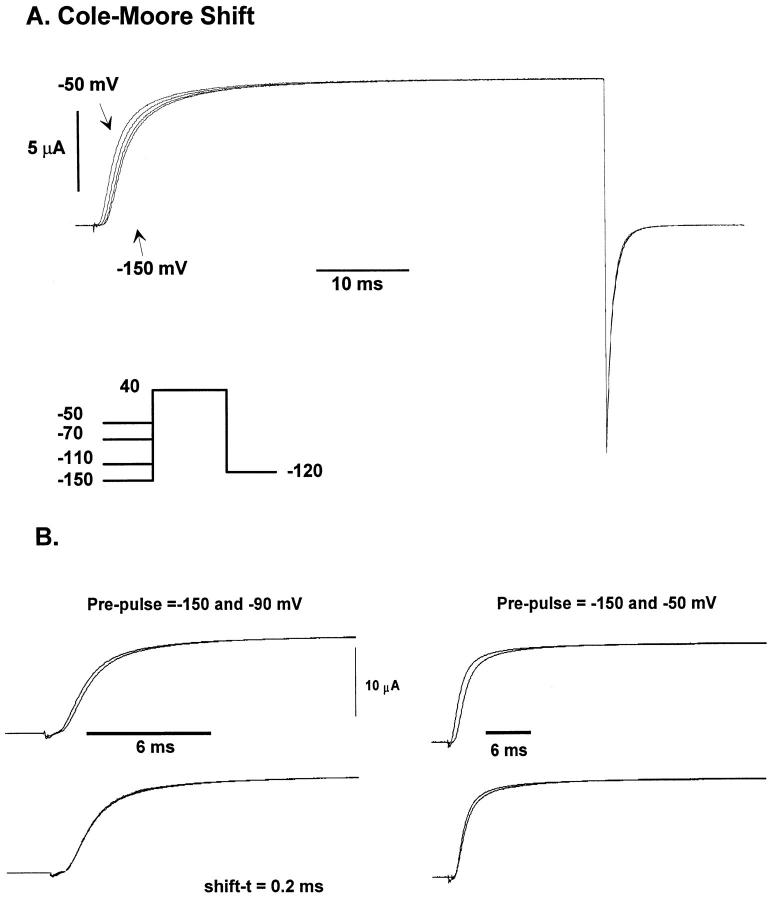
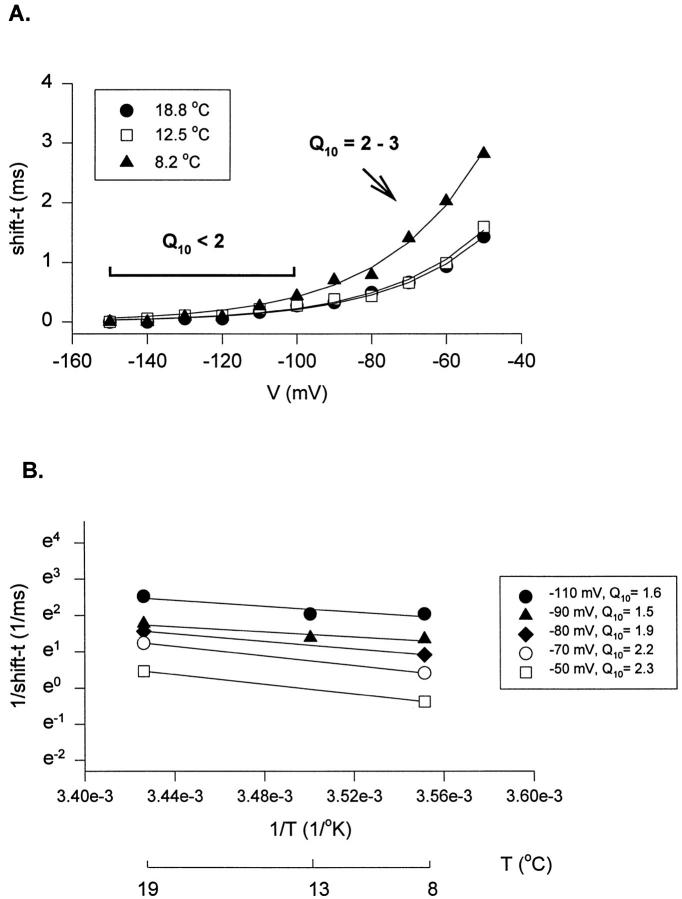
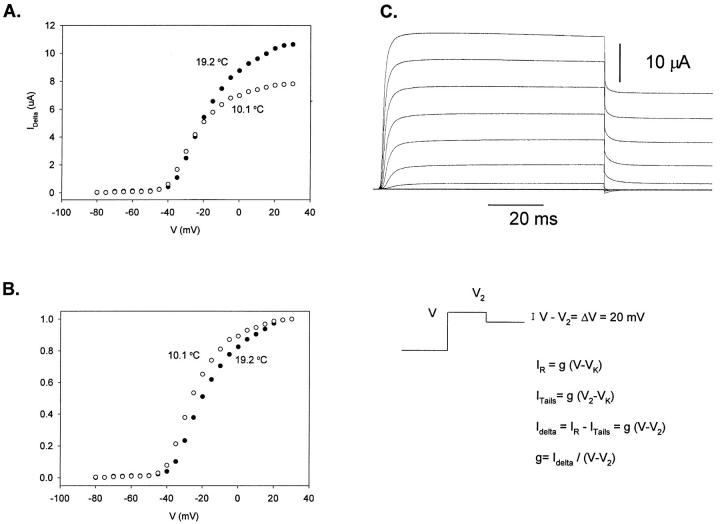
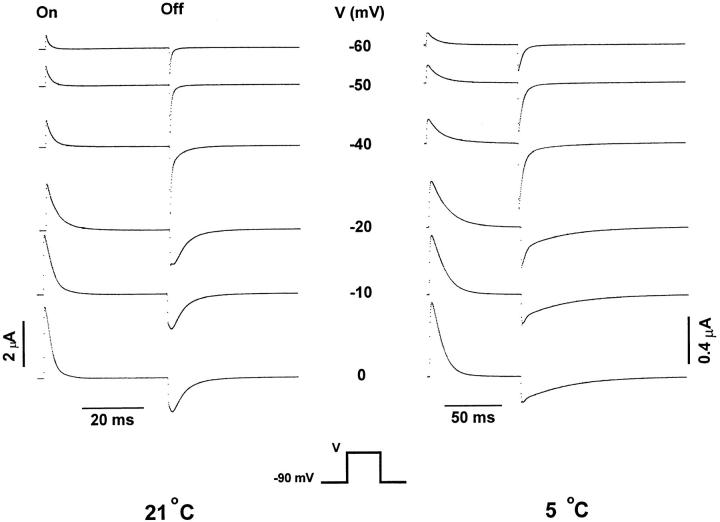
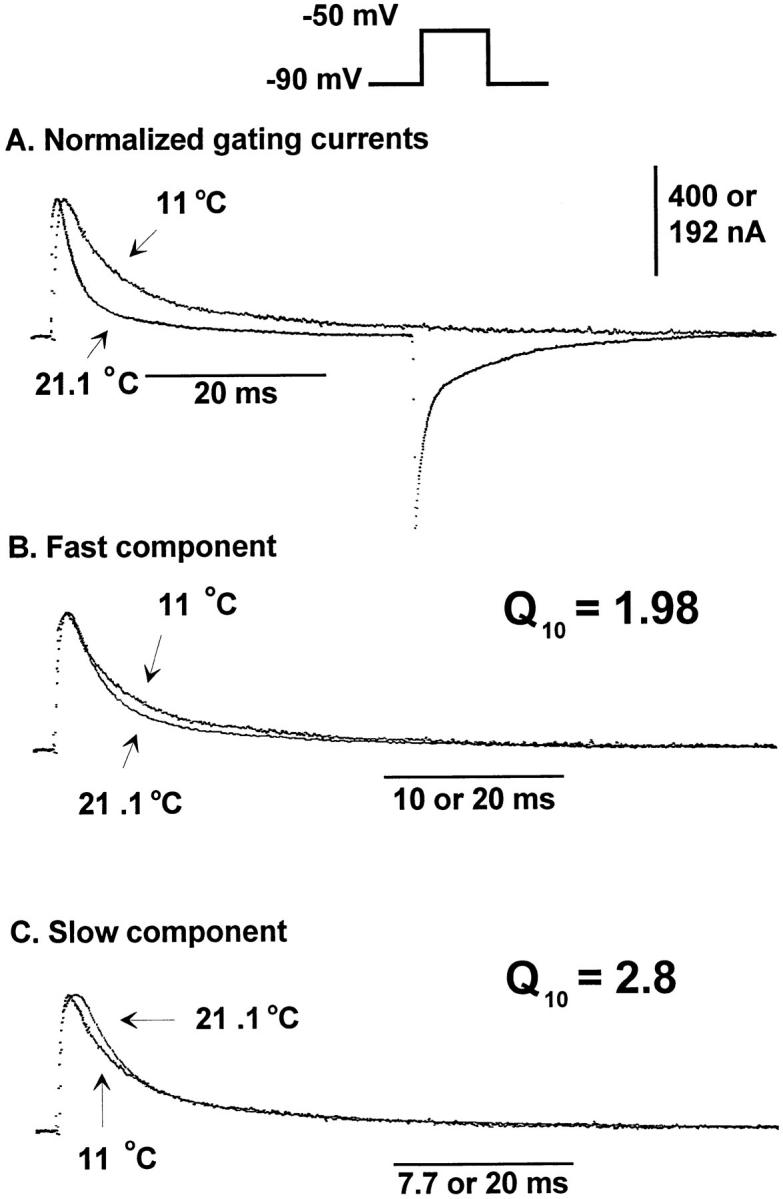
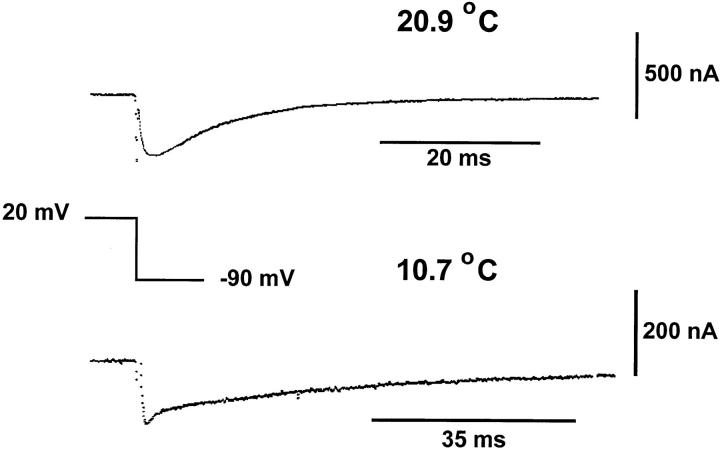
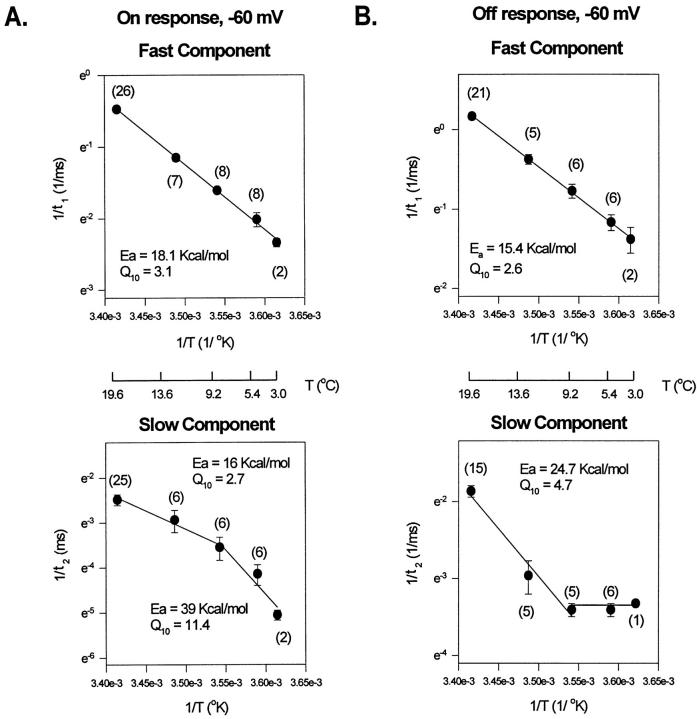
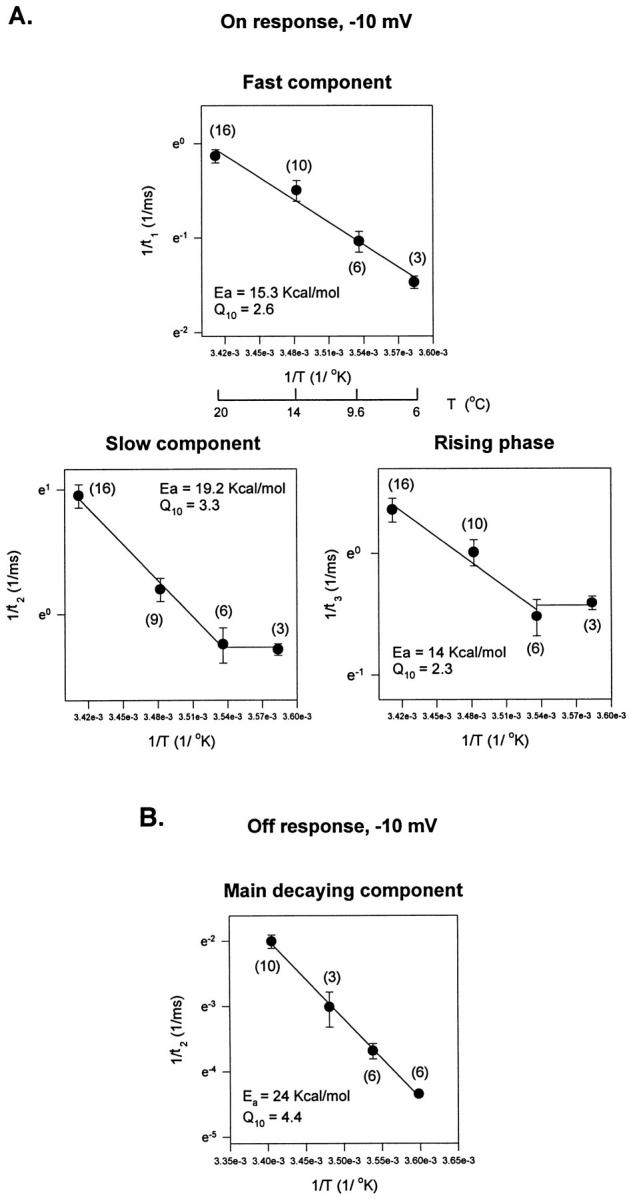
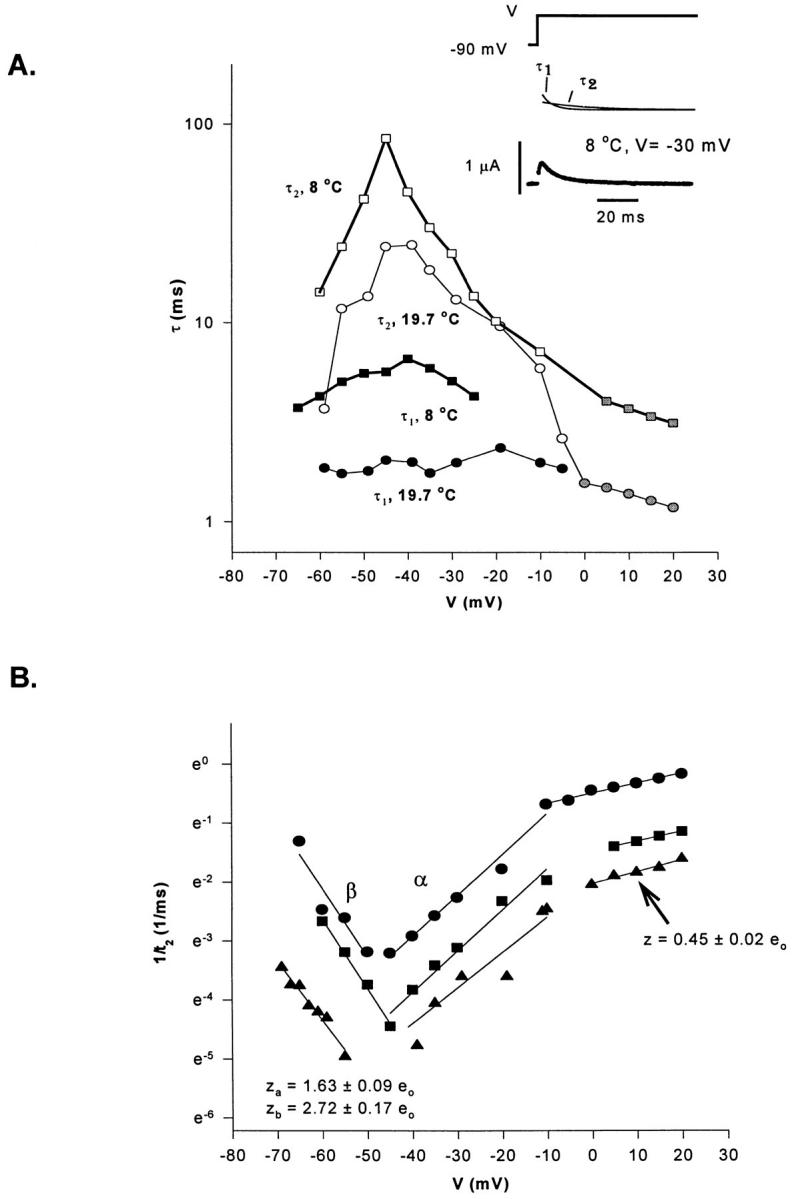
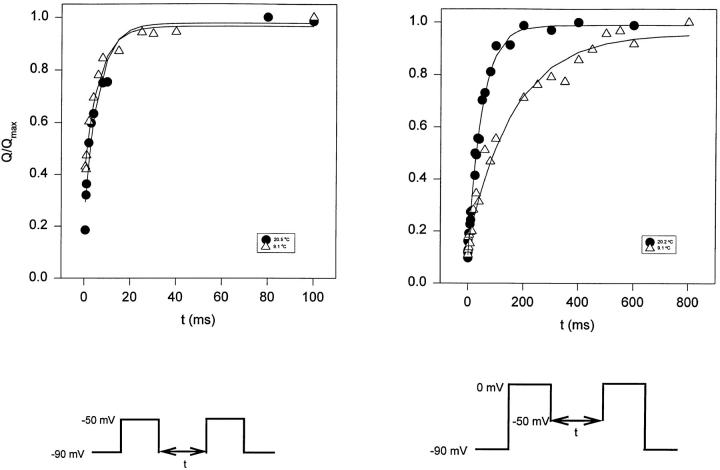
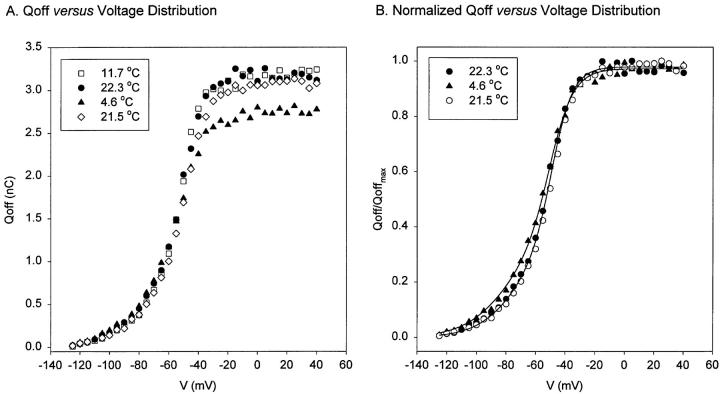
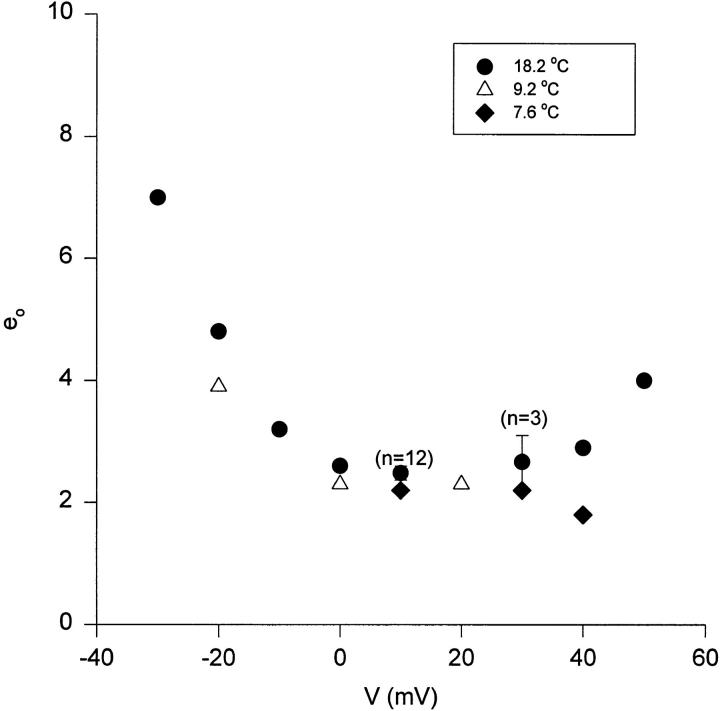
Ionic (Ii) and gating currents (Ig) from noninactivating Shaker H4 K+ channels were recorded with the cut-open oocyte voltage clamp and macropatch techniques. Steady state and kinetic properties were studied in the temperature range 2-22 degreesC. The time course of Ii elicited by large depolarizations consists of an initial delay followed by an exponential rise with two kinetic components. The main Ii component is highly temperature dependent (Q10 > 4) and mildly voltage dependent, having a valence times the fraction of electric field (z) of 0.2-0.3 eo. The Ig On response obtained between -60 and 20 mV consists of a rising phase followed by a decay with fast and slow kinetic components. The main Ig component of decay is highly temperature dependent (Q10 > 4) and has a z between 1.6 and 2.8 eo in the voltage range from -60 to -10 mV, and approximately 0.45 eo at more depolarized potentials. After a pulse to 0 mV, a variable recovery period at -50 mV reactivates the gating charge with a high temperature dependence (Q10 > 4). In contrast, the reactivation occurring between -90 and -50 mV has a Q10 = 1.2. Fluctuation analysis of ionic currents reveals that the open probability decreases 20% between 18 and 8 degreesC and the unitary conductance has a low temperature dependence with a Q10 of 1.44. Plots of conductance and gating charge displacement are displaced to the left along the voltage axis when the temperature is decreased. The temperature data suggests that activation consists of a series of early steps with low enthalpic and negative entropic changes, followed by at least one step with high enthalpic and positive entropic changes, leading to final transition to the open state, which has a negative entropic change.


Figures

Figure 6
Figure 6
Probability of being open (P o) as a function of voltage (V). The P o values were calculated from ionic fluctuation studies at different temperatures and voltages with the macropatch technique. Inset shows an example of a plot of the variance σ2(t) versus mean current, I(t) used to determine P o, the unitary conductance (γ), and the number of channels (n). ○, data obtained from 257 ionic current traces obtained at 17°C and using a test pulse of −20 mV. A 120-mM K+ internal solution and 10-mM K+ external solution were used. Solid line shows the fit with Eq. (1). Parameters fitted: i, unitary current = 0.46 pA; n = 11,800; γ = 13.8 pS; P o = 0.7551. At 17–18°C, P omax was 0.71 ± 0.02 (n = 17), at 8°C was 0.63 ± 0.03* (n = 11) and at 4°C was 0.60 ± 0.02 (n = 10). Data obtained at temperatures below 8°C were significantly different from data obtained at 17–18°C (*P < 0.002 and P < 0.0008).
Figure 16
Figure 16
Data and model prediction. Family of gating current traces (○) obtained at two different temperatures (21 and 11°C) fitted with an 11-state sequential model (dots) with parameters shown in Table III. Unsubtracted gating currents elicited in response to variable test pulses from −120 to 0 mV. Holding potential was −90 mV. The test pulses were 40- and 80-ms long at 21 and 11°C, respectively. Data obtained at 21°C was filtered at 5 kHz and digitized every 50 μs. Data obtained at 11°C was filtered at 2.5 kHz and digitized every 80 μs.
Figure 1
Figure 1
Macroscopic ionic currents from ShH4ir at 15.1°C and 8.5°C. Currents were elicited in response to test pulses from −80 to +80 mV in 10-mV increments from and returning to a holding potential of −90 mV. The test-pulse duration was 40 ms at 15.1°C and 180 ms at 8.5°C. Data obtained at 15.1°C was filtered at 5 kHz and digitized every 50 μs. Data obtained at 8.5°C was filtered at 1 kHz and digitized every 180 μs. Internal solution 120 K+-MES and external solution 60 K+-MES. A P/−4 subtraction protocol was used.
Figure 2
Figure 2
Kinetics of ionic current activation in response to depolarized potentials (>20 mV). Ionic currents were fit to a sum of two exponential functions: I(t) = a + bexp(−t/τ1) + c  exp(−t/τ2), where I(t) is the macroscopic ionic current as a function of time, t. The ionic current trace was fitted after the initial delay. (A) Proportion of kinetic components of ionic currents obtained at depolarized potentials as a function of voltage at two different temperatures 19.2°C (•, ▪) and 5.1°C (○, □). (B) Reciprocal of the time constant of the fast kinetic component (1/τfast) as a function of voltage (V). Estimation of the valence times the fraction of electric field (z) from the slope = zF/RT. The value of z obtained at each temperature tested (between 19.2 and 5.1°C) is between 0.2 and 0.28 eo. (C) Proportion of kinetic components of ionic currents obtained at depolarized potentials as a function of temperature from ionic currents obtained at two different test pulses: 40 mV (○, □) and 80 mV (•, ▪). (D) Arrhenius plot for the fast kinetic component from ionic currents elicited by a test pulse to 50 mV. The energy of activation (Ea) obtained from the slope = −Ea/R. Results shown in A–D as the mean ± SEM from several experiments.
Figure 3
Figure 3
Kinetics of early transitions of the activation pathway using the Cole-Moore protocol. (A) Family of macroscopic ionic currents from ShH4ir obtained at 15.1°C elicited in response to variable hyperpolarized prepulses (between −150 and −50 mV), followed by a 40-mV test pulse and a postpulse of −120 mV (Cole-Moore protocol). The holding potential was −90 mV. A P/−4 subtraction protocol was used. Data was filtered at 5 kHz and digitized every 60 μs. Internal solution: 120 K+-MES, and external solution, 60 K+-MES. (B) Superposition of the ionic current traces obtained with the Cole-Moore protocol at 18.7°C. Holding potential was −90 mV. P/−4 subtraction protocol was used. Data was filtered at 5 kHz and digitized every 50 μs. Internal solution 120 K+-MES and external solution 60 K+-MES. Shown are the ionic current superposition after shifting in time (shift-t), using as a reference the current obtained with a −150 mV prepulse. Notice the excellent superposition between the traces obtained with prepulses of −90 and −150 mV, and the poor superposition of the −50 and −150 mV pre-pulses.
Figure 4
Figure 4
Temperature dependence of the Cole-Moore shift (shift-t). (A) Delay or time shift (shift-t, in milliseconds) due to the hyperpolarized prepulses at different temperatures. Lines show fit to a single exponential function of the voltage dependence of the Cole-Moore shift at each temperature tested. (B) Arrhenius plot of the Cole-Moore shift. 1/shift-t as a function of temperature at different voltages of prepulses.
Figure 5
Figure 5
Conductance (G) versus voltage (V) curve. (A) G-V curves obtained at two different temperatures, 19.2 (•) and 10.05 (○) °C. (B) Normalized delta family G-V curves for the same data shown in A. Notice the shift to the left when the temperature decreases, (∼−5 mV), corresponding to an entropic change (TΔS at 20°C) of ∼−7 kcal/mol. (C) Macroscopic ionic currents elicited with the Delta-V protocol at 19.2°C. Data obtained was filtered at 7.5 kHz and digitized every 30 μs. Test pulses (V) from −80 to 30 mV in 10-mV increments, keeping constant the difference with respect to the postpulse potential (V2) (V − V2 = 20 mV). Holding potential = −90 mV. VK, reversal potential; IR, current measured at the end of the test pulse; Itails, current measured at the onset of the postpulse; G, macroscopic conductance = nγ(V) P o, where n is the number of channels, γ(V) is the unitary conductance, and P o is open probability. Internal solution 120 K+-MES and external solution 20 K+-MES. The P/−4 subtraction protocol was used.
Figure 7
Figure 7
Temperature effects on the time course of gating currents. Unsubtracted family of gating currents from shH4ir-W434F obtained at 21 and 5°C elicited in responses to variable test pulses (V). Holding potential was −90 mV. The test pulses were 40- and 80-ms long at 21 and 5°C, respectively. Postpulses were 40- and 240-ms long at 21 and 5°C, respectively. Data obtained at 21°C was filtered at 2 kHz and digitized every 70 μs. Data obtained at 5°C was filtered at 2.5 kHz and digitized every 190 μs. Notice the large effect of temperature in the kinetics of the Off response of gating currents, particularly at depolarized potentials.
Figure 8
Figure 8
Kinetic behavior for the On response of gating currents obtained at −50 mV. Unsubtracted traces elicited in responses to a test pulse of −50 mV at 21.1 and 11°C. The holding potential was −90 mV. The test pulses were 40- and 80-ms long at 21.1 and 11°C, respectively. Postpulses were 160-ms long. Data obtained at 21.1°C was originally filtered at 5 kHz and digitized every 50 μs. The trace shown in the figure was digitally filtered at 2 kHz to compare with data obtained at 11°C. Data obtained at 11°C was filtered at 2 kHz and digitized every 80 μs. (A) Normalized gating currents. Traces obtained at 21.1 and 11°C normalized for the size of the peak of the On response of the gating current (multiplying by 2.08) and superimposed. (B) Fast component. Gating current trace obtained at 21.1°C multiplied by a time-expansion factor (2×) to superimpose with the first part of the gating current trace obtained at 11°C. (C) Slow component. Gating current trace obtained at 21.1°C multiplied by a time-expansion factor (2.6×) to superimpose with the second part of the gating current trace obtained at 11°C. 0 K+/0 Na+ internal and external solutions.
Figure 9
Figure 9
Time course of the Off response of gating current obtained at depolarized potentials at different temperatures. Unsubtracted Off responses traces elicited after a test pulse of 20 mV returning to −90 mV (holding potential). Traces obtained at 20.9 and 10.7°C. Gating current trace obtained at 20.9°C was originally filtered at 5 kHz and digitized every 50 μs. Trace shown in the figure was digitally filtered to 2 kHz. Gating current trace obtained at 10.7°C was filtered at 2 kHz and digitized every 80 μs. Notice that at low temperature the rising phase is lost and a faster decaying component appears.
Figure 10
Figure 10
Arrhenius plots of the decaying kinetic components of the gating currents elicited as a response to a test pulse of −60 mV. The On and the Off responses of the experimental traces were fitted with a three- exponential function: a rising phase followed by two decaying components. (A) Arrhenius plots for the On response decaying kinetic components at −60 mV. (B) Arrhenius plot for the Off response decaying components. Energy of activation, E a, obtained from the slope of the Arrhenius plot (slope = −E a/R).
Figure 11
Figure 11
Arrhenius plots of kinetic components describing the gating currents elicited as a response to a test pulse of −10 mV. (A) Arrhenius plots for the On response kinetic components: fast component, slow component, and rising phase. (B) Arrhenius plot for the main decaying component of the Off response. The Arrhenius plot for the time constant of the faster decaying component that appears at low temperatures was not included (see Fig. 9).
Figure 12
Figure 12
Time constants (τ) of the decaying components of the On response of gating currents as a function of voltage (V). (A) Voltage and temperature dependence for each kinetic component for three different experiments. Open symbols represent the slow decaying component: ○ at 19.7°C, □ at 8°C. Closed symbols represent the fast decaying component: • at 19.7°C, ▪ at 8°C. Gray symbols indicate the voltage region where the On response was fitted with one exponential function. (B) Time constant of the slow decaying component (1/τ2, 1/ms) as a function of voltage (V). Determination of the valence times the fraction of the electric field (z). Data obtained from the same experiment shown in A at three different temperatures: 19.2°C, •; 8°C, ▪; 4.5°C, ▴. Lines represent the linear regression used to estimate z from the slope of each curve (slope = z.F/ RT) at each voltage region. Notice the change in the slope for the data obtained at depolarized potentials (>−10 mV), corresponding to z = 0.45 ± 0.02 eo (n = 3). Between −65 and −45 mV, backward rates predominate, z = 2.72 ± 0.17 eo (n = 3). Between −45 and −10 mV, forward rates predominate: z = 1.63 ± 0.09 eo (n = 3).
Figure 13
Figure 13
Reactivation of gating currents after a variable recovery interval showing the kinetic behavior for each component of the total charge movement. Normalized charge movement (Q/Qmax) as a function of the duration of the test-pulse (t, ms) at two different temperatures (20.5 and 9.1°C). Data obtained from the integration of the On response of the gating currents elicited using the double-pulse protocol (Oxford, 1981), between −90 and −50 mV (left), and between −50 and 0 mV (right).
Figure 14
Figure 14
Q-V distributions at different temperatures. (A) Nonnormalized data from the experiment (Qoff, charge movement during the Off response versus V, voltage). Data obtained from unsubtracted gating current traces elicited from variable test pulses (V). At 11.7 and 4.6°C (□, ▴) test-pulse duration was 300 ms. At 22°C (•, ⋄), test-pulse duration was 100 ms. (B) Normalized data obtained at 4.6°C (▴) and 22°C (•, ○) (Q/Qmax versus V curve). The continuous line corresponds to the fitting with a two-step sequential Boltzmann distribution (see Eq. 6). Parameters obtained from the fit: n = 4 × 10⁹ channels (average value for low and high temperature); z 1 = 1.70 ± 0.11 eo (n = 2); z 2 = 3.13 ± 0.29 eo (n = 2). At 22°C, V1 = −73.35 mV; V2 = −48.87 mV; Q1 = 0.34; Q2 = 0.64. At 4.6°C, V1 = −80.01 mV; V2 = −50.34 mV; Q1 = 0.35; Q2 = 0.62. At low temperature, the first component is shifted to the left by −7 mV, corresponding to a net decrease in entropy of ∼4 kcal/ mol at 20°C (see Table II).
Figure 15
Figure 15
Elementary gating charge movement. Temperature and voltage dependence. Measurement of the elementary charge movement (eo) estimates the value of the predominant charge transfer in the activation pathway. Gating current ensembles consisting of >100 traces at each voltage in the saturated region of the Q-V were obtained with the macropatch technique. The experiment was performed at three temperatures (18.2°C, •; 9.2°C, ▵; and 7.6°C, ♦).

Similar articles

Cited by

References

    1. Aggarwal SK, MacKinnon R. Contribution of the S4 segment to gating charge in the Shaker K+channel. Neuron. 1996;16:1169–1177. - PubMed
    1. Armstrong CM, Bezanilla F. Inactivation of the sodium channel. II. Gating current experiments. J Gen Physiol. 1977;70:567–590. - PMC - PubMed
    1. Bendorf K, Koopmann R. Thermodynamic entropy of two conformational transitions of single Na+channel molecules. Biophys J. 1993;65:1585–1589. - PMC - PubMed
    1. Bezanilla F, Perozo E, Stefani E. Gating of Shaker K+-channels: II. The components of gating currents and a model of channel activation. Biophys J. 1994;66:1011–1021. - PMC - PubMed
    1. Bezanilla F, Taylor RE. Effect of temperature on gating currents. Biophys J. 1978a;21:85a. - PMC - PubMed

Publication types