. 1998 Aug 4;95(16):9111-6.
doi: 10.1073/pnas.95.16.9111.

RNA-binding site in T7 RNA polymerase

Affiliations

RNA-binding site in T7 RNA polymerase

S Sastry et al. Proc Natl Acad Sci U S A. .

Abstract

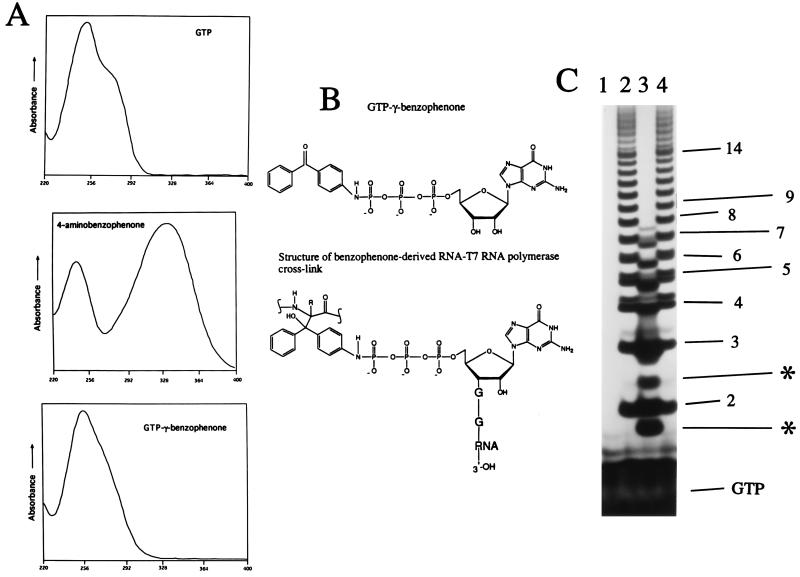
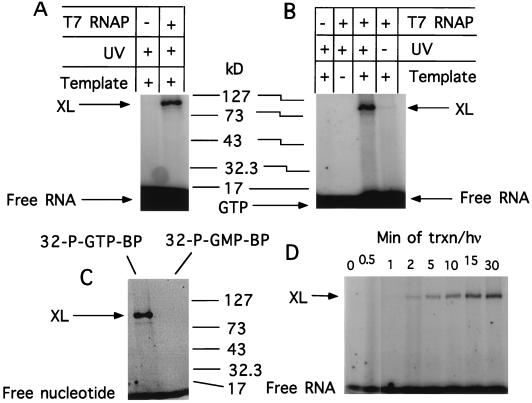
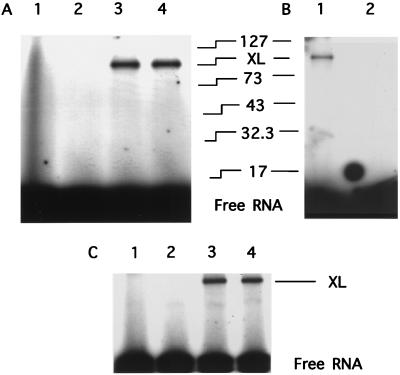
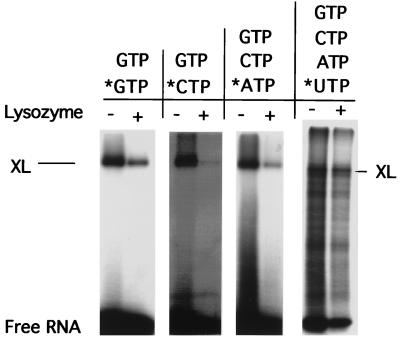
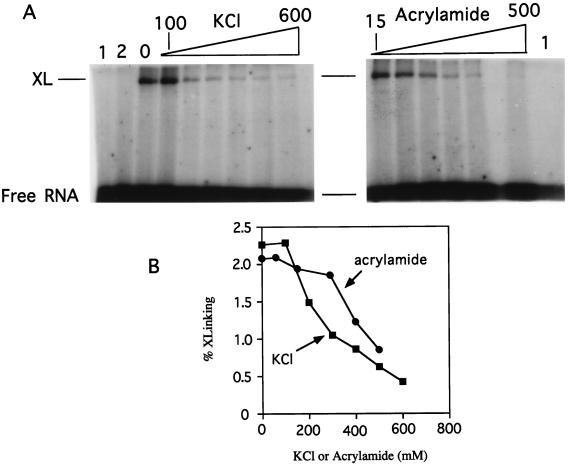
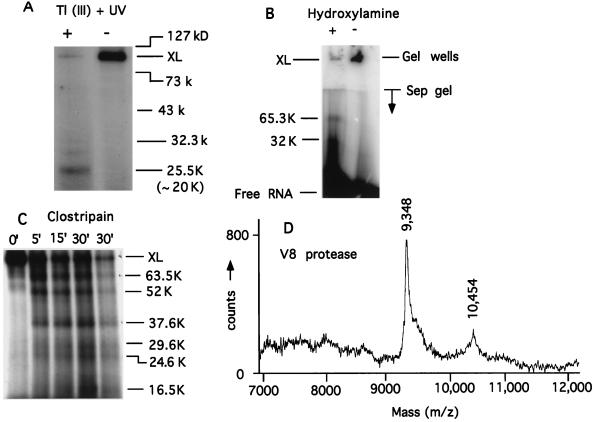
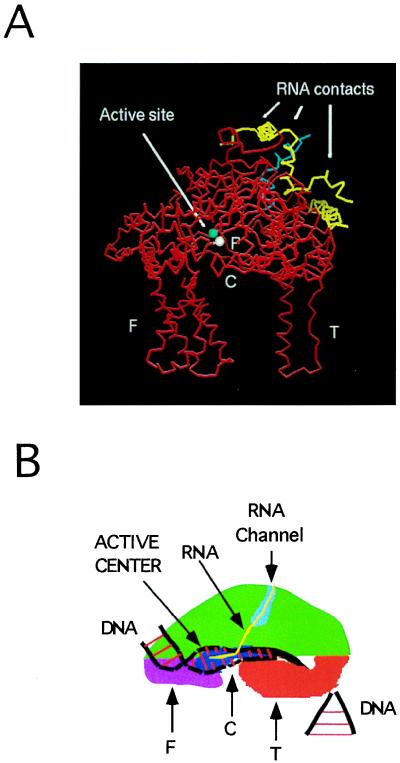
Recent models of RNA polymerase transcription complexes have invoked the idea that enzyme-nascent RNA contacts contribute to the stability of the complexes. Although much progress on this topic has been made with the multisubunit Escherichia coli RNA polymerase, there is a paucity of information regarding the structure of single-subunit phage RNA polymerase transcription complexes. Here, we photo-cross-linked the RNA in a T7 RNA polymerase transcription complex and mapped a major contact site between amino acid residues 144 and 168 and probably a minor contact between residues 1 and 93. These regions of the polymerase are proposed to interact with the emerging RNA during transcription because the 5' end of the RNA was cross-linked. The contacts are both ionic and nonionic (hydrophobic). The specific inhibitor of T7 transcription, T7 lysozyme, does not compete with T7 RNA polymerase for RNA cross-linking, implying that the RNA does not bind the lysozyme. However, lysozyme may act indirectly via a conformational change in the polymerase. In the current model, the DNA template lies in the polymerase cleft and the fingers subdomain may contact or maintain a template bubble, and a region in the N terminus forms a partly solvent-accessible binding channel for the emerging RNA.


Figures

Figure 1
Figure 1
(A) UV-VIS absorption spectra of GTP, 4-aminobenzophenone and GTP-γ-BP. (B) Structure of GTP-γ-BP and the presumed structure of 5′-BP-GTP-RNA-T7 RNAP cross-links. RNA cross-link with a generic polypeptide backbone unit is depicted. (C) Transcription with cold GTP-BP. Lane 1, no polymerase; lanes 2 and 4, normal G-ladder; and lane 3, G-ladder with cold GTP-γ-BP. Asterisks show examples of BP-RNAs. In lanes 1, 2, and 4, the total concentration of unmodified cold GTP plus [α-32P]GTP was 280 μM. In lane 3, to better visualize the GTP-γ-BP-initiated transcripts, the reaction was biased with a higher concentration of cold GTP-γ-BP (250 μM) compared with the total concentration (30 μM) of unmodified cold GTP plus [α-32P]GTP. [α-32P]GTP was the only radio nucleotide in these reactions.
Figure 2
Figure 2
Cross-linking of T7 RNAP to RNA. (A) Requirement of T7 RNAP for cross-linking. (B) Requirement of template for cross-linking. (C) Cross-linking only with labeled GTP-BP. (D) Time course of cross-linking. The numbers at the top are minutes after T7 RNAP addition and start of UV irradiation. In A, B, and D, reactions contained cold GTP-BP + cold GTP + [α-32P]GTP, whereas C contained either [γ-32P]GTP-BP + cold GTP or [α-32P]GMP-BP + cold GTP. XL, cross-links.
Figure 3
Figure 3
Cross-linked T7 RNAP is active. (A) Lane 1, cold GTP + [α-32P]GTP, no UV irradiation; lane 2, cold GTP + [α-32P]GTP plus UV irradiation; lane 3, cold GTP-BP + [α-32P]GTP + UV irradiation; lane 4, cold GTP-BP + UV irradiation + [α-32P]GTP. (B) Cross-linking of the RNA in a binary complex. Isolated 5′-BP containing 32P-labeled RNA was mixed with T7 RNAP in transcription buffer without NTPs and incubated for 15 min at 37°C. The reaction was then split in two halves. One was UV irradiated (lane 1) and the other was not irradiated (lane 2). Note that A (10% acrylamide gel) is slightly offset relative to B (12% acrylamide). The numbers in the middle show the relative positions of the protein markers in kDa. (C) Lane 1, cold GTP + [α-32P]CTP, no UV irradiation; lane 2, cold GTP + [α-32P]CTP plus UV irradiation; lane 3, cold GTP-BP + cold GTP + [α-32P]CTP + UV irradiation; lane 4, cold GTP-BP + cold GTP + UV irradiation + [α-32P]CTP.
Figure 4
Figure 4
Effect of T7 lysozyme on cross-linking. A transcription mixture was split in two halves. One received a 4-fold molar excess of T7 lysozyme over T7 RNAP. The other received a compensating volume of lysozyme storage buffer. Then T7 RNAP was added to both tubes and the reactions were incubated at 37°C for 10 min followed by UV irradiation. Asterisk indicates the [32P]NTP present in the reactions. All reactions contained only cold GTP-BP.
Figure 5
Figure 5
Effect of KCl or acrylamide. Transcription was carried out for 10 min and then KCl or acrylamide was added before irradiation. (A) Lanes 1, no template; lane 2, no UV irradiation. Lanes that are not labeled contained (from left to right) either 200, 300, 400, and 500 mM KCl or 60, 150, 300, and 400 mM acrylamide. The graph (B) shows quantitation of the extent of cross-linking.
Figure 6
Figure 6
Mapping the RNA-binding site. (A) Ten percent acrylamide-SDS Tris-Gly gel. Cleavage with thallium acetate + 254 nm of UV irradiation). Tl (III) OAc (100 mM) was added to cross-linked T7 RNAP and irradiated with 254 nm of UV light for 5 min. The size range of the markers is indicated while the actual (minus the mass of BP-RNA) mass of the proteolytic fragment is given in parentheses. (B) Cleavage with hydroxylamine. Ten percent acrylamide-SDS Tris-Gly gel. Purified cross-link was dissolved in 0.1 M K2CO3 (pH 10) and the cleavage was done as in ref. . To compensate for the lability of the P-N bond in the cross-link at pH 10, 37°C (where the NH2 OH-cleavage reaction occurred), we had to use 6- to 8-fold cross-linked T7 RNAP in the + lane to see the cleaved fragments. In lane − the cross-link ran near the gel well. The actual (i.e., minus the mass of BP-RNA) mass of the proteolytic fragments is given. Protein markers (not shown) were the same as in A. (C) Ten percent acrylamide-SDS Tris-Tricine gel. Cleavage with clostripain was carried out as specified by the manufacturer (Promega) at cross-link to protease mass ratio of 100:1. The actual (minus the mass of BP-RNA) mass of the proteolytic fragments is given. To better visualize the bands, less material was loaded in the last lane (30′) compared with the others. Protein markers (not shown) were the same as in A. (D) Cleavage with V8 protease in gel pieces was carried out according to the manufacturer (Promega) at cross-link to protease mass ratio of 10:1. The plot shows a trace of the mass spectrogram in the relevant mass range.
Figure 7
Figure 7
(A) α-Carbon backbone (red) representation of the crystal structure of T7 RNAP (10). The coordinates in Brookhaven PDB file (4RNP) were displayed using an INSIGHTII program and a Silicon Graphics workstation. The major cross-link site is in cyan and the minor site is in yellow. The white and blue spheres are D537 and D812, respectively, in the active site. (B) A model of transcription complex based on the shape of T7 RNAP. C, cleft; P, palm is in blue; T, thumb is in orange; F, fingers are in violet; the DNA is in black while the base pairs are in red; RNA is in yellow. The proposed RNA channel is shown in light blue.

Similar articles

Cited by

References

    1. Uptain S M, Kane C, Chamberlin M. Annu Rev Biochem. 1997;66:117–172. - PubMed
    1. Burley S K, Roeder R G. Annu Rev Biochem. 1996;65:769–799. - PubMed
    1. Gamper H B, Hearst J E. Cell. 1982;29:81–90. - PubMed
    1. Yager T D, von Hippel P H. Biochemistry. 1991;30:1097–1118. - PubMed
    1. Chamberlin M J. Harvey Lect. 1993;88:1–21. - PubMed

Publication types

MeSH terms

LinkOut - more resources