. 1998 Aug 4;95(16):9178-83.
doi: 10.1073/pnas.95.16.9178.

cAMP-dependent protein kinase phosphorylates and activates nuclear Ca2+-ATPase

Affiliations

cAMP-dependent protein kinase phosphorylates and activates nuclear Ca2+-ATPase

P J Rogue et al. Proc Natl Acad Sci U S A. .

Abstract

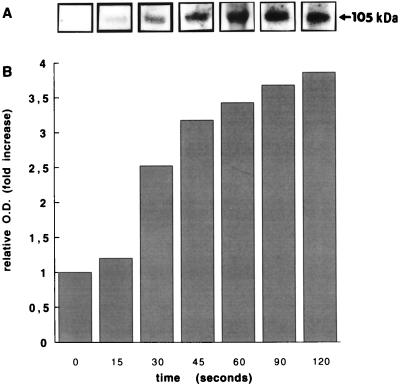
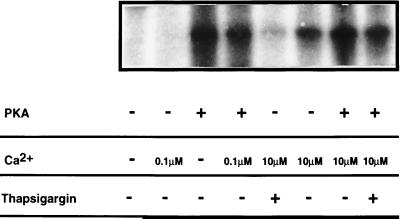
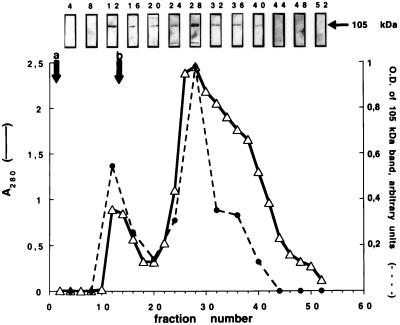
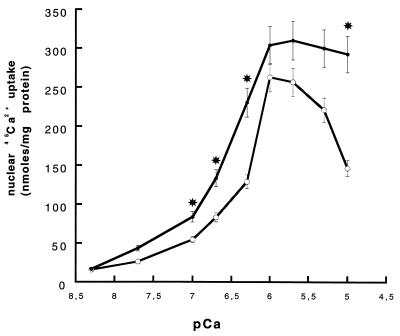
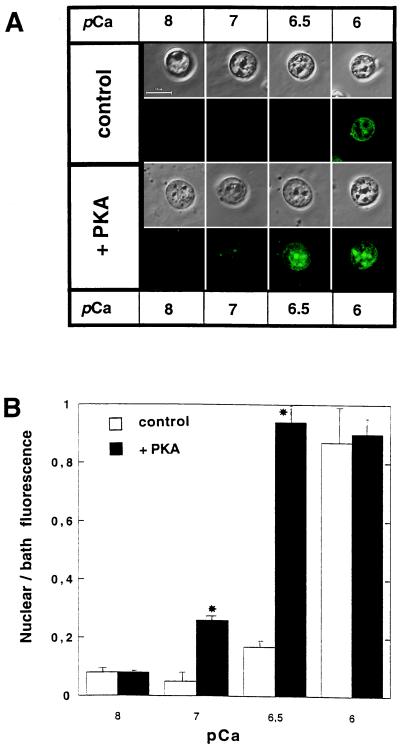
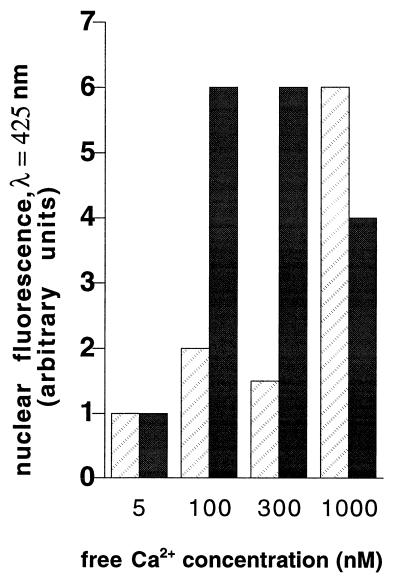
A Ca2+-pump ATPase, similar to that in the endoplasmic reticulum, has been located on the outer membrane of rat liver nuclei. The effect of cAMP-dependent protein kinase (PKA) on nuclear Ca2+-ATPase (NCA) was studied by using purified rat liver nuclei. Treatment of isolated nuclei with the catalytic unit of PKA resulted in the phosphorylation of a 105-kDa band that was recognized by antibodies specific for sarcoplasmic reticulum Ca2+-ATPase type 2b. Partial purification and immunoblotting confirmed that the 105-kDa protein band phosphorylated by PKA is NCA. The stoichiometry of phosphorylation was 0.76 mol of phosphate incorporated/mol of partially purified enzyme. Measurement of ATP-dependent 45Ca2+ uptake into purified nuclei showed that PKA phosphorylation enhanced the Ca2+-pumping activity of NCA. We show that PKA phosphorylation of Ca2+-ATPase enhances the transport of 10-kDa fluorescent-labeled dextrans across the nuclear envelope. The findings reported in this paper are consistent with the notion that the crosstalk between the cAMP/PKA- and Ca2+-dependent signaling pathways identified at the cytoplasmic level extends to the nucleus. Furthermore, these data support a function for crosstalk in the regulation of calcium-dependent transport across the nuclear envelope.


Figures

Figure 1
Figure 1
Time-dependent phosphorylation of NCA. Isolated nuclei were incubated with the catalytic unit of PKA (20 units) for the indicated times as described in Materials and Methods. (A) Representative autoradiogram; the arrow indicates the migration of the 105-kDa protein band. (B) Densitometric analysis of the same autoradiogram.
Figure 2
Figure 2
Characterization of NCA phosphorylation. Phosphorylation of isolated nuclei was carried out as described in the legend to Fig. 1. The various conditions used are described in Materials and Methods.
Figure 3
Figure 3
Partial purification of NCA by affinity chromatography. Reactive red-120 agarose column affinity chromatography was performed as described in Materials and Methods. NCA elution was monitored by immunoblot analysis of aliquots taken from every fourth eluted fraction by using antibodies specific for SERCA2b. A 105-kDa band was observed, which was analyzed by densitometric scanning of the immunoblots (broken line). Two bands were detected in certain fractions corresponding to peak II. Elution of proteins was measured by absorbance at 280 nm (A280, solid line).
Figure 4
Figure 4
Effect of PKA phosphorylation on ATP-dependent 45Ca2+-transport into intact isolated nuclei. Isolated nuclei before (○) and after phosphorylation (•) were incubated at 37°C for 5 min in the presence of 1 mM ATP. Calcium chloride was added into the medium bathing nuclei so as to give the indicated free calcium concentration according to Fabiato (34). Traces of 45Ca2+ were also present in the medium (2 μCi/ml; 1 Ci = 37 Gbq). Ca2+ uptake was terminated by filtering under vacuum over GF/B Whatman glass fiber filters, followed by scintillation counting of the 45Ca2+ trapped on the filters. Values are expressed as means ± SEM, and statistical significance was evaluated by using the Mann–Whitney U test (∗, P < 0.05, control vs. PKA).
Figure 5
Figure 5
Transport of 10-kDa Calcium Green-1 dextran into intact isolated nuclei. (A) Micrographs showing Ca2+-dependent loading of nuclear preparation with 10-kDa Calcium Green-1 dextran under control and PKA-phosphorylated conditions. For each condition, fluorescence (λex ≈ 488 nm, λem ≈ 531 nm, Upper) and corresponding phase-contrast (Lower) micrographs are shown. (B) Quantification of confocal fluorescence micrographs. Background fluorescence values were subtracted. Data are presented as mean values ± SEM. Statistical significance was assessed by using the Mann–Whitney U test. (∗, P < 0.05, control vs. PKA).
Figure 6
Figure 6
Transport of 10-kDa dextran-coupled Lucifer yellow. Isolated rat liver nuclei were incubated with calcium uptake medium supplemented with 10-kDa dextran-coupled Lucifer yellow at various free calcium concentrations. Fluorescence was visualized with classical optical microscopy (max. λ ≈ 425 nm). Values are depicted in arbitrary units and are derived from two separate experiments with less than 10% variation between independent values. Control (hatched bars) and PKA phosphorylated (solid bars).

Similar articles

Cited by

References

    1. Malviya A N, Rogue P. Cell. 1998;92:17–23. - PubMed
    1. Malviya A N, Rogue P, Vincendon G. Proc Natl Acad Sci USA. 1990;87:9270–9274. - PMC - PubMed
    1. Köppler P, Matter N, Malviya A N. J Biol Chem. 1993;268:26248–26252. - PubMed
    1. Gerasimenko O V, Gerasimenko J V, Tepikin A V, Petersen O H. Cell. 1995;80:439–444. - PubMed
    1. Lanini L, Bachs O, Carafoli E. J Biol Chem. 1992;267:11548–11552. - PubMed

Substances

LinkOut - more resources