. 1998 Aug 4;95(16):9256-61.
doi: 10.1073/pnas.95.16.9256.

Experimental study of the interaction range and association rate of surface-attached cadherin 11

Affiliations

Experimental study of the interaction range and association rate of surface-attached cadherin 11

A Pierres et al. Proc Natl Acad Sci U S A. .

Abstract

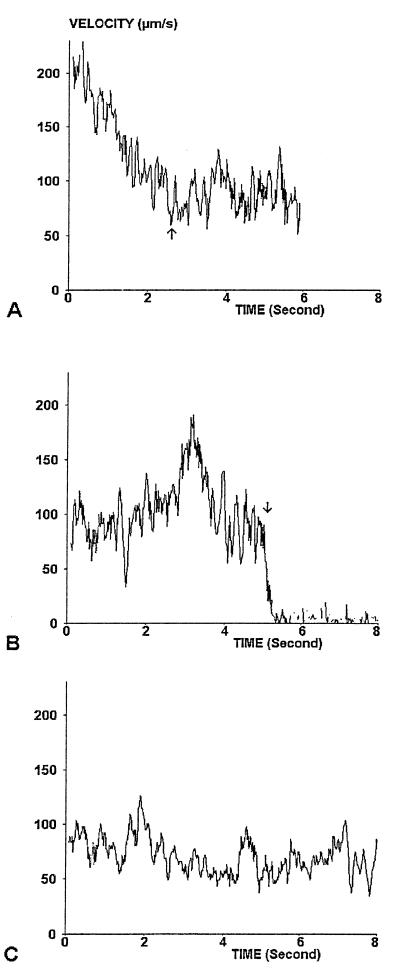
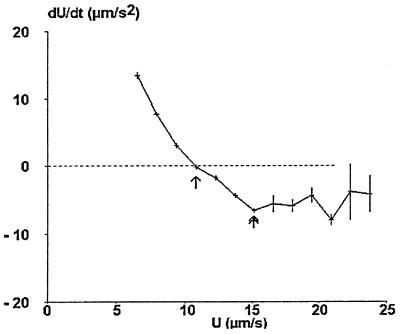
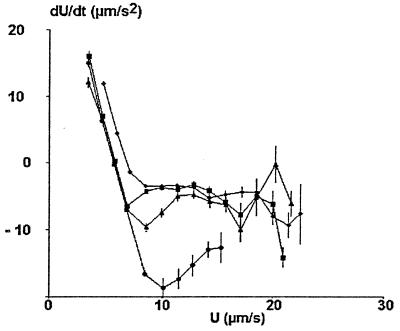
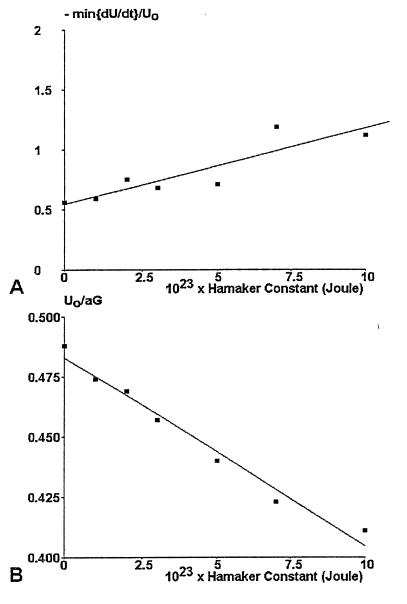
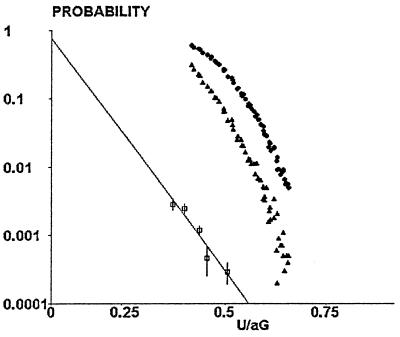
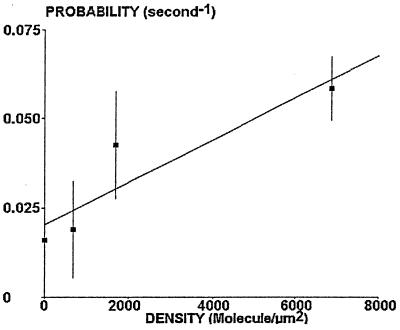
We describe a method allowing quantitative determination of the interaction range and association rate of individual surface-attached molecules. Spherical beads (1.4 micro(m) radius) were coated with recombinant outer domains of the newly described classical type II cadherin 11, a cell adhesion molecule. Beads were driven along cadherin-coated surfaces with a hydrodynamic force of approximately 1 pN, i.e., much less than the mechanical strength of many ligand-receptor bonds. Spheres displayed periods of slow motion interspersed with arrests of various duration. Particle position was monitored with 50 Hz frequency and 0.025 micro(m) accuracy. Nearly 1 million positions were recorded and processed. Comparison between experimental and computer-simulated trajectories suggested that velocity fluctuations might be related quantitatively to Brownian motion perpendicular to the surface. The expected amplitude of this motion was of order of 100 nm. Theoretical analysis of the relationship between sphere acceleration and velocity allowed simultaneous determination of the wall shear rate and van der Waals attraction between spheres and surface. The Hamaker constant was estimated at 2.9 x 10(-23) J. The frequency of bond formation was then determined as a function of sphere velocity. Experimental data were consistent with the view that the rate of association between a pair of adhesion molecules was approximately 1.2 x 10(-3) s-1 and the interaction range was approximately 10 nm. It is concluded that the presented methodology allows sensitive measurement of sphere-to-surface interactions (with approximately 10 fN sensitivity) as well as the effective range and rate of bond formation between individual adhesion molecules.


Figures

Figure 1
Figure 1
Sample trajectories. Actual (A and B) or simulated (C) trajectories are shown. (A) The motion of a particle that entered the observation field with high velocity and displayed progressive slowing (until arrow) before displaying velocity fluctuations around a constant value. (B) The motion of a particle that displayed a typical binding event (arrow) resulting in immediate stop. (A) Simulated trajectory that was qualitatively similar to the motion of real particles.
Figure 2
Figure 2
Velocity dependence of mean particle acceleration (actual curve). A representative series of particle trajectories was used to determine the mean particle acceleration and velocity at ≈22,000 positions. Mean values are shown. Vertical bar length is twice the SEM. The curve allows accurate determination of the velocity U0 corresponding to zero average acceleration (arrow). A clearcut minimum of the acceleration was reproducibly found in the interval [U0, 1.5 U0] (double arrow).
Figure 3
Figure 3
Velocity dependence of mean particle acceleration (simulated curves). Series of ≈60 simulated trajectories (800 positions each) were generated with a Hamaker constant of 0 (diamonds), 10−22 (squares), 10−21 (triangles), or 10−20 (circles) J and a wall shear rate of 10 s−1. The mean acceleration was determined for 10–20 velocity groups and displayed vs. velocity (vertical bar length is twice the SEM). Remarkable points of the curve were the velocity U0 corresponding to zero value of dU/dt and the first minimum of dU/dt (in the interval [U0, 1.5 U0]). Note that the SEM is fairly low when U is lower than ≈1.5U0. This minimum exhibited a sharp decrease when the Hamaker constant increased.
Figure 4
Figure 4
Use of trajectory analysis to determine the wall shear rate and Hamaker constant. Seven series of simulated trajectories (48,000 positions each) were generated for a constant shear rate of 10 s−1 and different values of the Hamaker constant. The velocity U0 at zero acceleration and the minimum value of d[U/U0] in the velocity interval [U0, 1.5 U0] were determined and plotted vs. Hamaker constant. These curves were used to determine first the Hamaker constant (A) and second the wall shear rate (B).
Figure 5
Figure 5
Determination of the range and rate of association between surface-bound molecules. Simulated curves were used to determine the relationship between particle mean velocity (in a 0.16-s interval) and corrected time passed within binding distance with respect to the chamber floor. Typical curves are shown for 5 nm (triangles) and 40 nm (circles) range. Squares represent experimental values of the binding frequency of cadherin-coated particles moving along cadherin-coated surfaces.
Figure 6
Figure 6
Concentration dependence of binding frequency. Cadherin-coated spheres were driven along surfaces coated with varying density of binding sites. The binding frequency was determined for a ratio U/aG of 0.45 ± 0.02. Mean values are shown (vertical bar length is twice the SEM). In accordance with our crude model, the binding frequency is linearly dependent on the density of binding sites.

References

    1. Tha S P, Shuster J, Goldsmith H L. Biophys J. 1986;50:1117–1126. - PMC - PubMed
    1. Kaplanski G, Farnarier C, Tissot O, Pierres A, Benoliel A M, Alessi M C, Kaplanski S, Bongrand P. Biophys J. 1993;64:1922–1933. - PMC - PubMed
    1. Alon R, Hammer D A, Springer T A. Nature (London) 1995;374:539–542. - PubMed
    1. Tees D F J, Goldstmith H L. Biophys J. 1996;71:1102–1114. - PMC - PubMed
    1. Pierres A, Benoliel A M, Bongrand P, van der Merwe P A. Proc Natl Acad Sci USA. 1996;93:15114–15118. - PMC - PubMed

Publication types

LinkOut - more resources