. 1998 Aug 4;95(16):9307-12.
doi: 10.1073/pnas.95.16.9307.

Short-term regulation of insulin gene transcription by glucose

Affiliations

Short-term regulation of insulin gene transcription by glucose

B Leibiger et al. Proc Natl Acad Sci U S A. .

Abstract

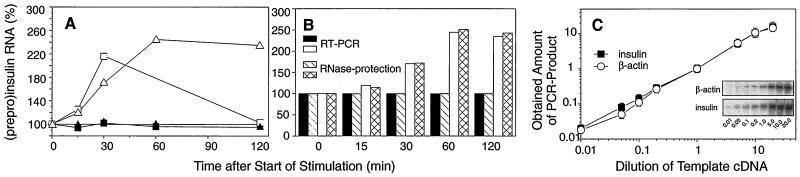
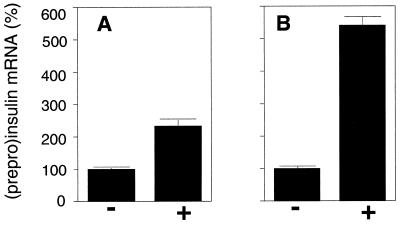
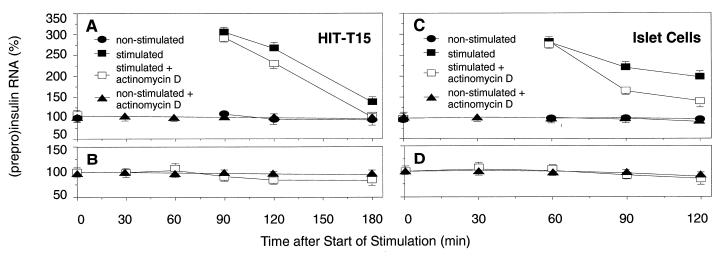
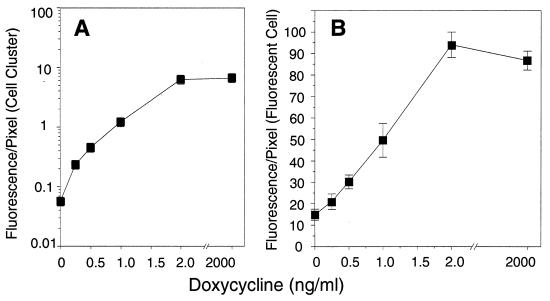
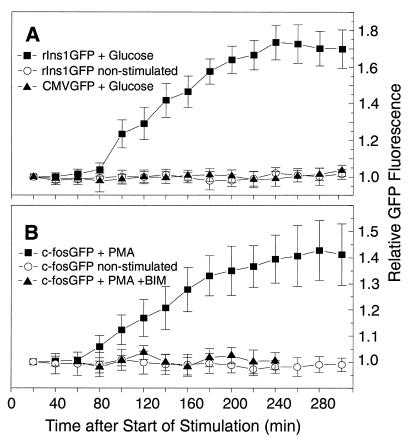
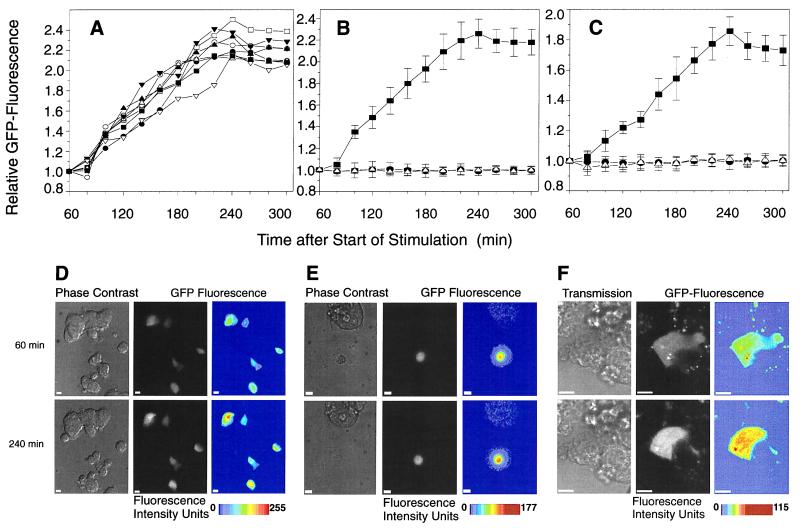
Whereas short-term regulation of insulin biosynthesis at the level of translation is well accepted, glucose-dependent transcriptional control is still believed to be a long-term effect occurring after more than 2 hr of glucose stimulation. Because pancreatic beta cells are exposed to elevated glucose levels for minutes rather than hours after food uptake, we hypothesized the existence of a short-term transcriptional control. By studying the dynamics of newly synthesized (prepro)insulin RNA and by employing on-line monitoring of gene expression in single, insulin-producing cells, we were able to provide convincing evidence that insulin gene transcription indeed is affected by glucose within minutes. Exposure of insulinoma cells and isolated pancreatic islets to elevated glucose for only 15 min resulted in a 2- to 5-fold elevation in (prepro)insulin mRNA levels within 60-90 min. Similarly, insulin promoter-driven green fluorescent protein expression in single insulin-producing cells was significantly enhanced after transient glucose stimulation. Thus, short-term signaling, such as that involved in insulin secretion, also may regulate insulin gene transcription.


Figures

Figure 1
Figure 1
(A) Dynamics of transcription initiation (squares) and cytoplasmic PPI mRNA amounts (triangles) in response to short-term glucose stimulation in HIT cells. Transcription initiation was studied by nuclear run-off analysis in nuclei of nonstimulated cells (■) cultured at 0.1 mM glucose and cells stimulated for 15 min with 16.7 mM glucose (□). Amounts of cytoplasmic PPI mRNA were determined by RNase-protection analysis. The mRNA levels of nonstimulated cells are shown as ▴ and of stimulated cells as ▵. The values of PPI mRNA were normalized to amounts of β-actin mRNA. Elevation of RNA levels in stimulated cells is shown as percentage of RNA levels of the nonstimulated control (given as 100%). Data are from a representative experiment. This experiment has been performed three times with similar results. Maximum elevation of transcription initiation at 30 min varied from 2.1- to 2.7-fold; maximum elevation of cytoplasmic PPI mRNA at 60 min varied from 1.9- to 2.8-fold. (B) Dynamics of cytoplasmic PPI mRNA levels obtained from the run-off experiment were measured by RNase-protection analysis and by comparative RT-PCR. mRNA levels of nonstimulated cells are shown as hatched bars (RNase-protection) and solid bars (RT-PCR). mRNA levels of stimulated cells are presented as cross-hatched bars (RNase-protection) and open bars (RT-PCR). Values of PPI mRNA were normalized to amounts of β-actin mRNA. Elevation of PPI mRNA levels in stimulated cells is presented as percentage of mRNA levels of the nonstimulated control (100%). (C) To prove that the amplification of both the PPI-mRNA-derived product (■) as well as the β-actin mRNA-product (○) remained in the linear range of PCR, the following dilutions of the template cDNA were used (0.01, 0.05, 0.1, 0.2, 1.0, 5.0, 10.0, and 20.0). Template cDNA was prepared from nonstimulated islets cultured at 5.6 mM glucose. The working dilution used for mRNA quantification is presented as 1.0. Shown values represent the average values of three independent experiments in arbitrary units. Inset shows data from a representative RT-PCR, performed three times.
Figure 2
Figure 2
Elevation of endogenous PPI mRNA levels after glucose stimulation in HIT-T15 cells (A) and in isolated rat pancreatic islets (B). RNA was prepared 90 min and 60 min after start of glucose stimulation of HIT cells and pancreatic islets, respectively. Amounts of PPI and β-actin mRNA were determined by RNase-protection analysis. The values of PPI mRNA were normalized to amounts of β-actin mRNA. Elevation of endogenous PPI mRNA levels in stimulated cells (+) is presented as percentage of mRNA levels of the nonstimulated control (−), the average value of which is given as 100%. All data are shown as mean values ± SD (n = 3).
Figure 3
Figure 3
The effect of short-term glucose stimulation on PPI mRNA stability in HIT-T15 cells (A and B) and pancreatic islet cells (C and D). (A and C) Analysis of the stability of the total PPI mRNA pool. (B and D) Analysis of the stability of the preexisting PPI mRNA pool. Values of PPI mRNA were normalized to amounts of β-actin mRNA. Elevation of RNA levels in stimulated cells is shown as percentage of RNA levels of the nonstimulated control, the average value of which is given as 100%. Data are shown as mean values ± SD (n = 3).
Figure 4
Figure 4
On-line monitoring of Tet-On promoter-driven GFP expression in HIT-T15 cells. GFP fluorescence of three independent series consisting of 20 individual HIT cell clusters was monitored by digital imaging fluorescence microscopy. Fluorescence was measured as “fluorescence/pixel of cell cluster,” where “cell cluster” reflects the sum of both GFP-expressing and nonexpressing cells (A) and as “fluorescence/pixel of GFP-expressing cell” (B). All data are shown as mean values ± SD.
Figure 5
Figure 5
On-line monitoring of insulin promoter-driven GFP expression (A) and c-fos promoter-driven GFP expression (B) in HIT-T15. On-line monitoring was started 20 min after the start of stimulation with glucose for rIns1GFP and with PMA for c-fosGFP. The 20-min value of GFP fluorescence was taken as 1.0. (A) On-line monitoring of individual HIT cells (n = 7) transfected with prIns1GFP and stimulated with 16.7 mM glucose for 15 min is shown as ■. Nonstimulated cells transfected with prIns1GFP (n = 10) are presented as ○. Cells transfected with pCMVGFP and stimulated with 16.7 mM glucose for 15 min are shown as ▴ (n = 10). (B) On-line monitoring of HIT cells transfected with pc-fosGFP. Cells stimulated for 15 min with 100 ng/ml PMA are shown as ■ (n = 7), and nonstimulated transfected cells are represented as ○ (n = 10). Transfected cells pretreated with 150 nM bisindolylmaleimide (BIM) and stimulated with PMA, shown as ▴ (n = 10), were monitored from minute 60 to 240 after start of stimulation. All data are shown as mean values ± SD.
Figure 6
Figure 6
On-line monitoring of insulin promoter-driven GFP expression in HIT-T15 cells and pancreatic islet cells. (A) On-line monitoring of eight individual HIT cells transfected with prIns1GFP and stimulated with 16.7 mM glucose for 15 min. (B) On-line monitoring of HIT cells transfected with prIns1GFP (■ and ▵) or pRcCMVGFP (•). Cells transfected with prIns1GFP (■, n = 8, summarized data from Fig. 2A) and with pRcCMVGFP (•, n = 10) were stimulated with 16.7 mM glucose. Nonstimulated cells transfected with prIns1GFP (n = 10) are shown as ▵. All data are shown as mean values ± SD. (C) On-line monitoring of pancreatic islet cells transfected with prIns1GFP (■ and ▵) or pRcCMVGFP (•). Cells transfected with prIns1GFP (■, n = 7) and with pRcCMVGFP (•, n = 10) were stimulated with 16.7 mM glucose. Nonstimulated cells transfected with prIns1GFP (n = 7) are shown as ▵. All data are shown as mean values ± SD. (DF) Representative images (out of a total of 50) of cells are shown 60 and 240 min after the start of glucose stimulation. Images were obtained either by digital imaging fluorescence microscopy from transfected HIT (D) and primary islet cells (E) or from transfected HIT cells by laser-scanning confocal microscopy (F). Fluorescence images are shown as “gray scale” and “pseudo-color.” The “pseudo-color” images were created by converting the original “gray scale” data using tina 2.07d software (Raytest); the fluorescence signal increased from blue to red. The monitored cell cluster also is shown as a transmission/phase-contrast image (confocal microscopy/digital imaging, respectively). The scale bars represent 10 μm.

References

    1. Welsh M, Nielsen D A, MacKrell A J, Steiner D F. J Biol Chem. 1985;250:13590–13594. - PubMed
    1. Welsh M, Scherberg N, Gilmore R, Steiner D F. Biochem J. 1986;235:459–467. - PMC - PubMed
    1. Gilligan M, Welsh G I, Flynn A, Bujalska I, Diggle T A, Denton R M, Proud C G, Docherty K. J Biol Chem. 1996;271:2121–2125. - PubMed
    1. Bailyes E M, Guest P C, Hutton J C. In: Insulin: Molecular Biology to Pathology. Ashcroft F M, Ashcroft S J H, editors. Oxford: IRL; 1992. pp. 64–92.
    1. Docherty K, Clark A. FASEB J. 1994;8:20–27. - PubMed

Publication types