. 1998 Aug 4;95(16):9384-9.
doi: 10.1073/pnas.95.16.9384.

A new satellite technology for tracking the movements of Atlantic bluefin tuna

Affiliations

A new satellite technology for tracking the movements of Atlantic bluefin tuna

B A Block et al. Proc Natl Acad Sci U S A. .

Abstract

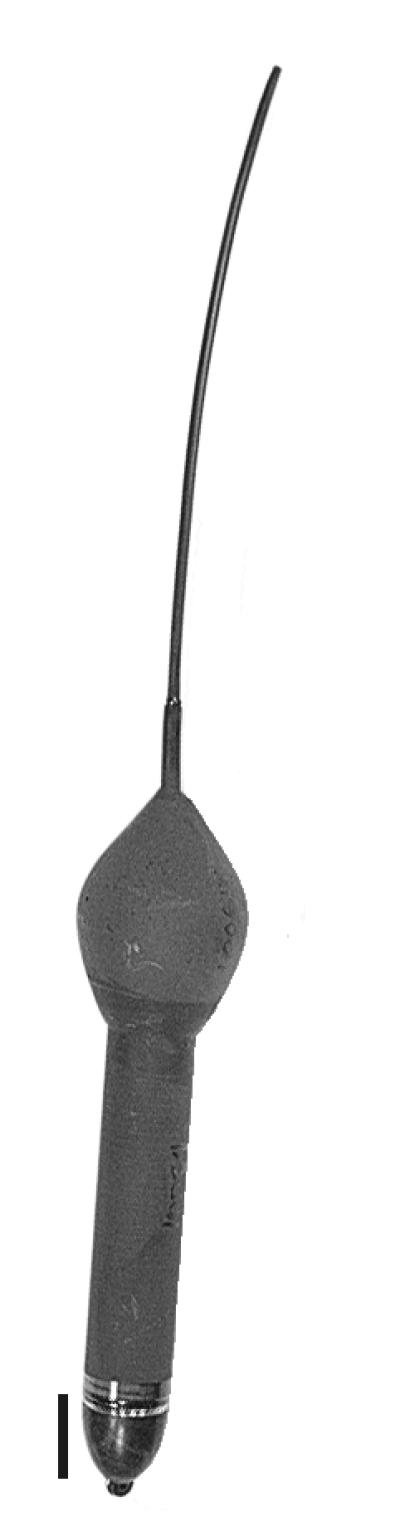
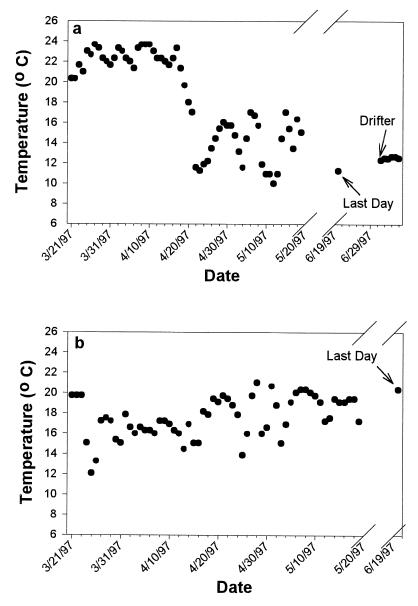
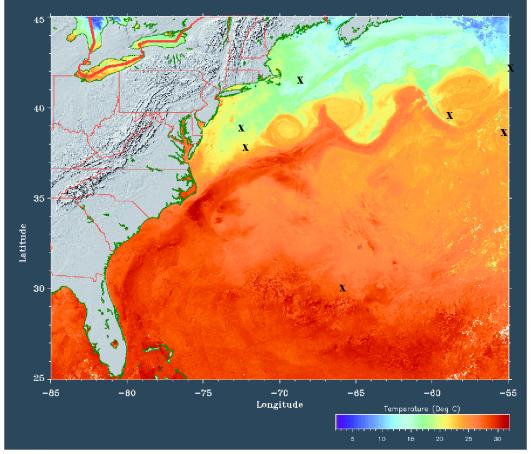
The movements of Atlantic bluefin tuna (Thunnus thynnus thynnus) have captured the interest of scientists and fishers since the time of Aristotle. This tuna is unique among bony fish for maintaining elevated body temperatures (21 degrees C above ambient) and attaining large size (up to 750 kg). We describe here the use of a pop-off satellite tag, for investigating the Atlantic-wide movements and potential stock overlap of western and eastern Atlantic bluefin tuna. The tag also archives data on water temperatures. The objectives of this study were to evaluate the effectiveness of the technology, study the movements of Atlantic bluefin tuna, examine their thermal niche, and assess survivorship of tagged fish. The pop-off satellite technology provides data independent of commercial fisheries that, when deployed in sufficient quantity, should permit a critical test of the stock structure hypotheses for Atlantic bluefin tuna.


Figures

Figure 1
Figure 1
Pop-off satellite tag. The monofilament leader (not shown) is attached through the plastic eye loop on the nose cone and is held in place by #316 stainless-steel wire, which corrodes at a programmed date, releasing the tag from the fish. (Bar = 2 cm.) The tag was manufactured with Telemetry 2000, Inc.
Figure 2
Figure 2
AVHRR image of Cape Hatteras with seven short-term, pop-off tag endpoints (solid circles). Shown are three-day tags (8832, 8969, 8971, 8972), 5-day tag (8833), 7-day tag (8834), and 14-day tag (8836). 9702 (X) is the endpoint of a short acoustic track of a fish released with pop-up satellite-tagged bluefin 8971 and 8972. Tags were deployed from February 26, 1997 to March 17, 1997. AVHRR image is a composite image from the week of March 17. Colors indicate sea surface temperatures. The positions of the Gulf Stream (red) and the Labrador current (blue) were consistent throughout the 3-week period of this experiment. All experiments began at start point.
Figure 3
Figure 3
(a) The mean (solid circles) of the average daily water temperatures (±SE) from nine short-term (3- to 14-day) pop-off tags. (b) Temperature with depth profiles (1 of 22 profiles shown) determined with a Seabird CTD probe revealed the warm water in the shallow continental shelf region off of Cape Hatteras. This profile was taken near the T in the word START in Fig. 2.
Figure 4
Figure 4
Distribution of 60- and 90-day pop-off endpoint positions for 25 of 28 bluefin tuna tagged in February and March off Cape Hatteras, NC (Start). Positions for two bluefin whose thermal records are shown in Fig. 5 are delineated as 9752 (A) and 9851 (B). Of the 28 fish tagged, 25 were larger than 183 cm (102 kg) and 13 were larger than 190 cm (121 kg). The shades of blue represent depth; the shallow waters are lightest in color. Arrows at 45° W indicate the stock boundary.
Figure 5
Figure 5
Daily average water temperatures for two bluefin tuna, denoted in Fig. 4 as A (9752) and B (9851), that went due north and east, respectively. Temperatures are recorded hourly and compiled as one 24-hr average (solid circles). The first 60 points represent the first 60 days, and the 61st data point is the average temperature from the last day before pop-off (day 90). The points after the final day are temperature measurements as the tag drifts on the surface after it releases from the fish. (a) Temperature data for bluefin 9752 (111 kg), which was double-tagged (both archival and pop-off tags deployed) and located on Georges Banks (A in Fig. 4) on June 21, 1997. (b) Thermal history for bluefin 9851, a 200-cm (136 kg) fish that moved the furthest north in the study and was in the Gulf Stream (not shown) when the tag released on June 19, 1997.
Figure 6
Figure 6
Composite AVHRR imagery of the western north Atlantic on June 22, 1997. Seven endpoint positions of bluefin tuna that released on this date ±3 days are shown in relationship to surface water temperatures (X). Similar AVHRR imagery was used to correlate the 61st data point and sea surface temperatures for 13 additional fish. Fish 9752 of Figs. 4 and 5a is denoted with an X off of Massachusetts.

References

    1. Carey F G, Lawson J. Comp Biochem Physiol. 1973;44:375–392. - PubMed
    1. International Commission for the Conservation of Atlantic Tunas. (1997) International Commission for Conservation of Atlantic Tunas, Collected Volume of Scientific Papers 46 (Madrid, Spain).
    1. National Research Council. An Assessment of Atlantic Bluefin Tuna. Washington, DC: Natl. Acad. Press; 1994. , 148 pp.
    1. Gulland J A. Fish Stock Assessment: A Manual of Basic Methods. FAO/Wiley Series on Food and Agriculture. New York: Wiley; 1983.
    1. Lehodey P, Bertignac M, Hampton J, Lewis A, Picaut J. Nature (London) 1997;389:715–718.

LinkOut - more resources