. 1998 Aug 4;95(16):9407-12.
doi: 10.1073/pnas.95.16.9407.

Evolutionary parameters of the transcribed mammalian genome: an analysis of 2,820 orthologous rodent and human sequences

Affiliations

Evolutionary parameters of the transcribed mammalian genome: an analysis of 2,820 orthologous rodent and human sequences

W Makalowski et al. Proc Natl Acad Sci U S A. .

Abstract

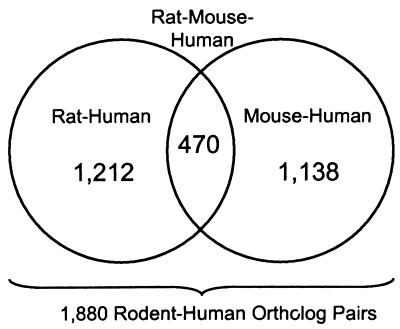
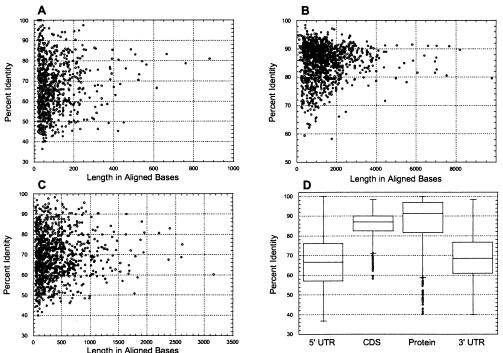
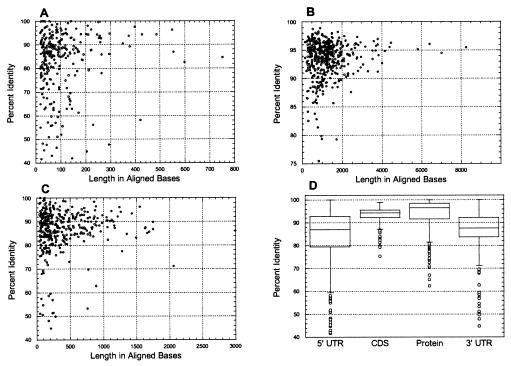
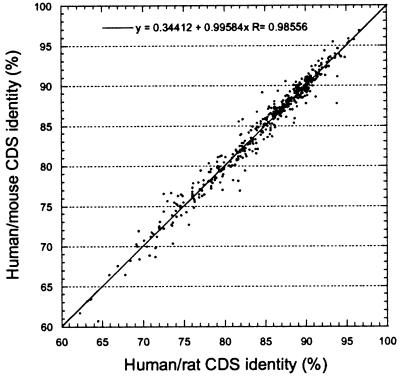
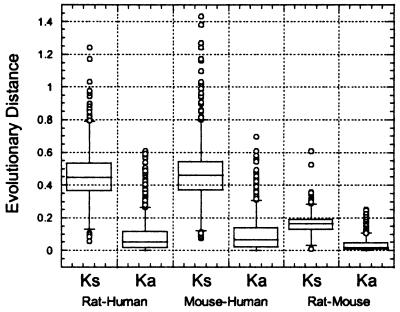
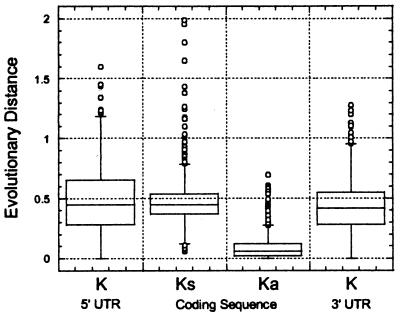
We have rigorously defined 2,820 orthologous mRNA and protein sequence pairs from rats, mice, and humans. Evolutionary rate analyses indicate that mammalian genes are evolving 17-30% more slowly than previous textbook values. Data are presented on the average properties of mRNA and protein sequences, on variations in sequence conservation in coding and noncoding regions, and on the absolute and relative frequencies of repetitive elements and splice sites in untranslated regions of mRNAs. Our data set contains 1,880 unique human/rodent sequence pairs that represent about 2-4% of all mammalian genes. Of the 1,880 human orthologs, 70% are present on a new gene map of the human genome, thus providing a valuable resource for cross-referencing human and rodent genomes. In addition to comparative mapping, these results have practical applications in the interpretation of noncoding sequence conservation between syntenic regions of human and mouse genomic sequence, and in the design and calibration of gene expression arrays.


Figures

Figure 1
Figure 1
Data sets of orthologous sequence pairs.
Figure 2
Figure 2
Distributions of lengths and degrees of sequence conservation for 1,212 aligned orthologous rat and human mRNA and protein sequences. (A–C) Scatter plots of results for 5′ UTRs (A), CDSs (B), and 3′ UTRs (C). (D) Box plots of sequence conservation by region for aligned rat and human mRNAs and encoded proteins. For each category, the central box depicts the middle 50% of the data between the 25th and 75th percentile, and the enclosed horizontal line represents the median value of the distribution. Extreme values are indicated by circles that occur outside the main bodies of data.
Figure 3
Figure 3
Distributions of lengths and degrees of sequence conservation for 470 aligned orthologous mouse and rat mRNA and protein sequences. (A–C) Scatter plots of results for 5′ UTRs (A), CDSs (B), and 3′ UTRs (C). (D) Box plots as described in the legend to Fig. 2.
Figure 4
Figure 4
Correlation of coding sequence identities between orthologous human/mouse and human/rat sequence pairs.
Figure 5
Figure 5
Analysis of evolutionary distances for orthologous sequence pairs.
Figure 6
Figure 6
Analysis of evolutionary distances in untranslated and coding regions of human–rodent mRNA sequences.

References

    1. Bassett, D. E., Boguski, M. S. & Hieter, P. (1996) Nature (London) 589–590. - PubMed
    1. Botstein D, Cherry J M. Proc Natl Acad Sci USA. 1997;94:5506–5507. - PMC - PubMed
    1. Mushegian A R, Bassett D E, Jr, Boguski M S, Bork P, Koonin E V. Proc Natl Acad Sci USA. 1997;94:5831–5836. - PMC - PubMed
    1. Li W-H. Molecular Evolution. Sunderland, MA: Sinauer; 1997.
    1. Hardison R C, Oeltjen J, Miller W. Genome Res. 1997;7:959–966. - PubMed

LinkOut - more resources