. 1998 Aug 4;95(16):9424-9.
doi: 10.1073/pnas.95.16.9424.

Mineralocorticoid receptor knockout mice: pathophysiology of Na+ metabolism

Affiliations

Mineralocorticoid receptor knockout mice: pathophysiology of Na+ metabolism

S Berger et al. Proc Natl Acad Sci U S A. .

Abstract

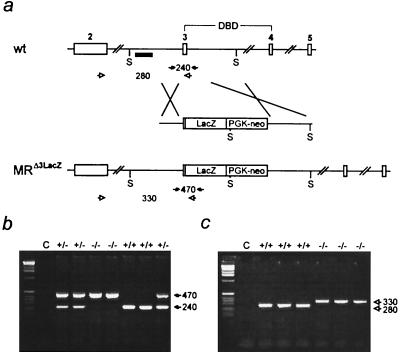
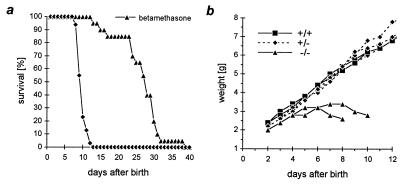
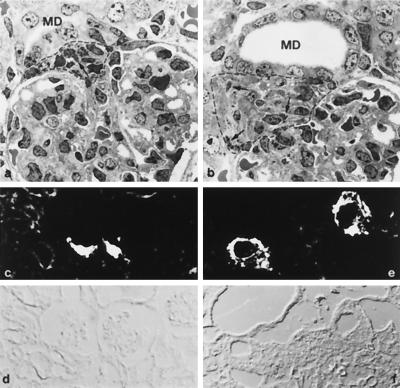
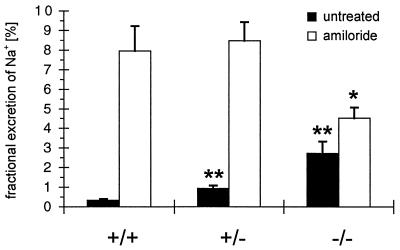
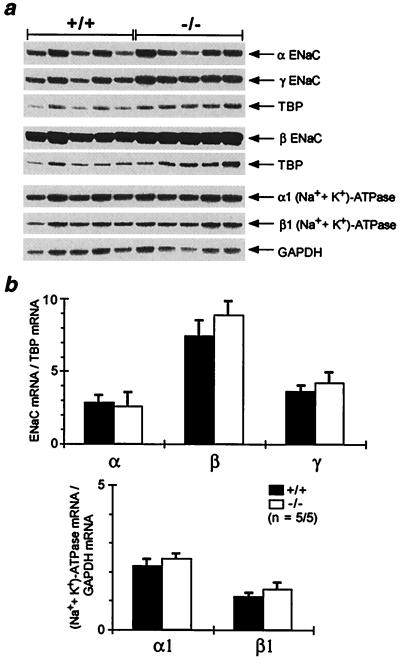
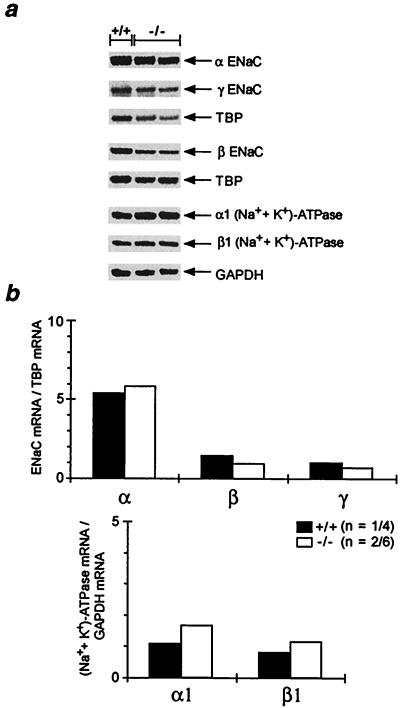
Mineralocorticoid receptor (MR)-deficient mice were generated by gene targeting. These animals had a normal prenatal development. During the first week of life, MR-deficient (-/-) mice developed symptoms of pseudohypoaldosteronism. They finally lost weight and eventually died at around day 10 after birth from dehydration by renal sodium and water loss. At day 8, -/- mice showed hyperkalemia, hyponatremia, and a strong increase in renin, angiotensin II, and aldosterone plasma concentrations. Methods were established to measure renal clearance and colonic transepithelial Na+ reabsorption in 8-day-old mice in vivo. The fractional renal Na+ excretion was elevated >8-fold. The glomerular filtration rate in -/- mice was not different from controls. The effect of amiloride on renal Na+ excretion and colonic transepithelial voltage reflects the function of amiloide-sensitive epithelial Na+ channels (ENaC). In -/- mice, it was reduced to 24% in the kidney and to 16% in the colon. There was, however, still significant residual ENaC-mediated Na+ reabsorption in both epithelia. RNase protection analysis of the subunits of ENaC and (Na++ K+)-ATPase did not reveal a decrease in -/- mice. The present data indicate that MR-deficient neonates die because they are not able to compensate renal Na+ loss. Regulation of Na+ reabsorption via MR is not achieved by transcriptional control of ENaC and (Na+ + K+)-ATPase in RNA abundance but by transcriptional control of other as yet unidentified genes. MR knockout mice will be a suitable tool for the search of these genes.


Figures

Figure 1
Figure 1
Inactivation of the mouse MR gene by gene targeting. (a) Targeting strategy. (Top) Part of the MR gene with exons 2, 3, 4, and 5. Exons 3 and 4 encode the two zinc fingers of the DNA binding domain (DBD). S indicates SpeI restriction sites, and the small black box indicates the 5′ probe used for Southern blot analysis. (Middle) Targeting construct. LacZ and PGK neo indicate the β-galactosidase gene and the neomycin-resistance gene driven by the phosphoglycerate kinase promoter. (Bottom) Targeted MR locus. (b) Genotyping by PCR of genomic tail DNA by using specific primers (filled arrows in a). Numbers between the arrows indicate the size of the amplified fragments in bp. C, water control. (c) Reverse transcription–PCR analysis of cDNA derived from total kidney RNA of wild-type (+/+) and MR-deficient (−/−) mice by using exon- and LacZ-specific primers (open arrows in a) demonstrates the absence of the 280-bp wild-type-specific band in MR −/− mice. Instead, only the 330-bp band specific for the MRΔ3-LacZ fusion mRNA is present.
Figure 2
Figure 2
Survival and weight curve. (a) Survival of MR −/− and betamethasone-treated MR −/− mice. Application of betamethasone from day 5 after birth prolonged survival on average by 17 days. (b) Weight curve of MR −/− mice and their heterozygous (+/−) and wild-type (+/+) littermates.
Figure 3
Figure 3
Histological and immunocytochemical analysis of the kidney. Transmission electron micrographs of glomeruli and vascular pole region of wild-type (a) and MR −/− mice (b) from day 8 after birth. In MR −/− mice, the macula densa segment of the distal tubule (MD) was enlarged. The extraglomerular mesangium (encircled by a dotted line) showed prominent hyperplasia with granules (arrows in a and b) in almost every cell. Renin immunocytochemistry (c and e) and corresponding phase contrast pictures (d and f) of 8-day-old mice. In MR −/− mice, (e) staining for renin at the vascular pole region is much more prominent than in wild-type mice (c).
Figure 4
Figure 4
Fractional excretion of Na+. At day 8 after birth, the fractional excretion of Na+ of untreated (black columns) and amiloride-treated (white columns) MR −/−, heterozygous (+/−), and wild-type (+/+) animals was determined. Values of MR-deficient (−/−) or heterozygous (+/−) animals that are statistically different from wild-type (+/+) are marked with asterisks. ∗, P < 0.05; ∗∗, P < 0.005 (see also Table 2).
Figure 5
Figure 5
mRNA abundance of ENaC and (Na++ K+)-ATPase in kidney. (a) Analysis of the mRNA abundance of the α-, β-, and γ-subunit of the ENaC and α1- and β1-subunit of the (Na++ K+)-ATPase in kidneys of 8-day-old wild-type (+/+) and MR-deficient (−/−) mice by ribonuclease protection assay. (b) Ribonuclease protection assay signal was quantified by phosphoimaging, and results are expressed as ratio of the respective subunit mRNA to TBP (TATA-box binding protein) and GAPDH (glyceraldehydephosphate dehydrogenase) mRNA, respectively, used as internal standards. n, number of measurements/number of animals used.
Figure 6
Figure 6
mRNA abundance of ENaC and (Na++ K+)-ATPase in colon. (a) Analysis of the mRNA abundance of the α-, β-, and γ-subunit of the ENaC and α1- and β1-subunit of the (Na++ K+)-ATPase in colons of 8-day-old wild-type (+/+) and MR-deficient (−/−) mice by ribonuclease protection assay. (b) Ribonuclease protection assay signal was quantified by phosphoimaging, and results are expressed as ratio of the respective subunit mRNA to TBP (TATA-box binding protein) and GAPDH (glyceraldehydephosphate dehydrogenase) mRNA, respectively, used as internal standards. n, number of measurements/number of animals used. Because single colon RNA preparations did not yield enough RNA, ribonuclease protection assays were performed with RNA from pooled colons. Therefore, no SEM bars are given in b.

References

    1. Hollenberg S M, Weinberger C, Ong Estelita S, Cerelli G, Oro A, Lebo R, Thompson E B, Rosenfeld M G, Evans R M. Nature (London) 1986;318:635–641. - PMC - PubMed
    1. Arriza J L, Weinberger C, Cerelli G, Glaser T M, Handelin B L, Housman D E, Evans R M. Science. 1987;237:268–275. - PubMed
    1. Funder J W. J Steroid Biochem Mol Biol. 1992;43:389–394. - PubMed
    1. Zennaro M C, Farman N, Bonvalet J P, Lombes M. J Clin Endocrinol Metab. 1997;82:1345–1352. - PubMed
    1. Arriza J L, Simerly R B, Swanson L W, Evans R M. Neuron. 1988;1:887–900. - PubMed

Publication types