. 1998 Aug 4;95(16):9430-5.
doi: 10.1073/pnas.95.16.9430.

Trichostatin A causes selective loss of DNA methylation in Neurospora

Affiliations

Trichostatin A causes selective loss of DNA methylation in Neurospora

E U Selker. Proc Natl Acad Sci U S A. .

Abstract

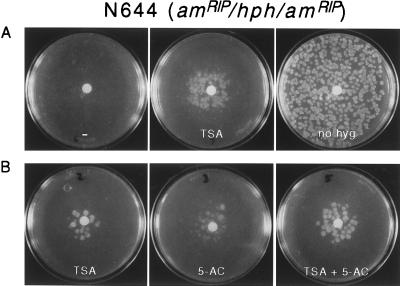
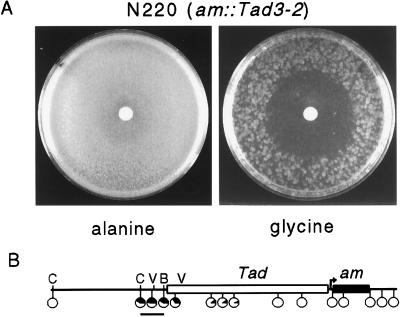
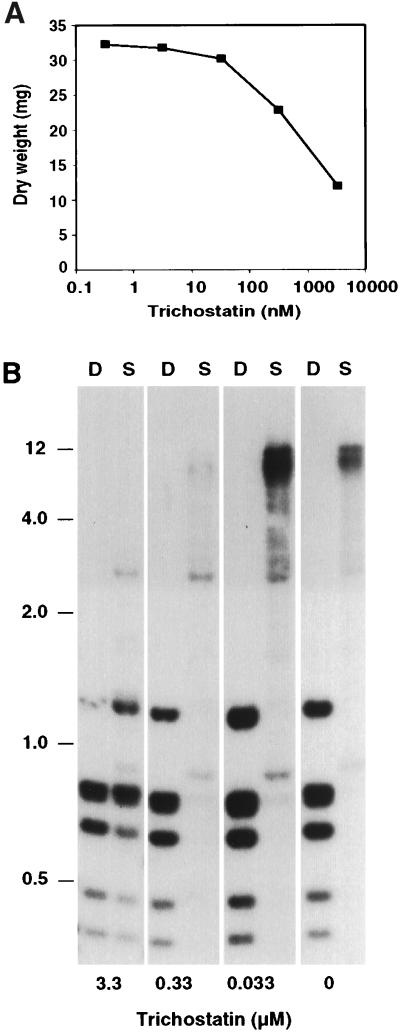
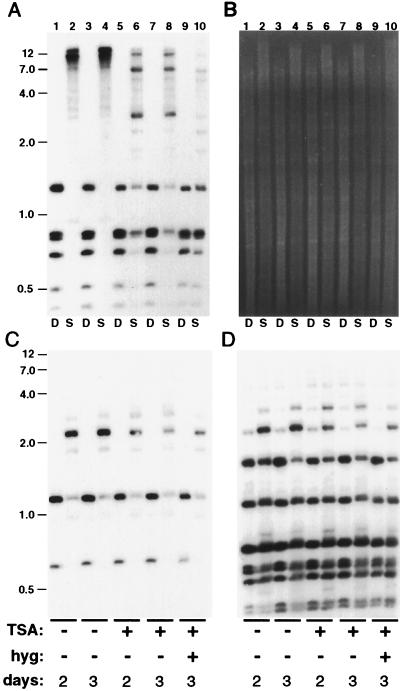
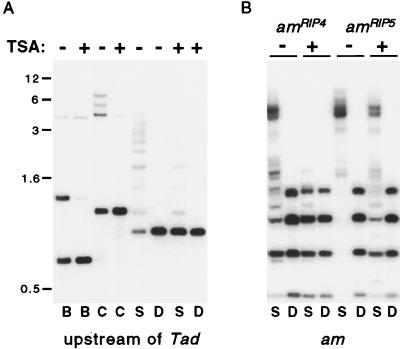
Both DNA methylation and hypoacetylation of core histones are frequently associated with repression of gene expression. Possible connections between these processes were investigated by taking advantage of genes controlled by methylation in Neurospora crassa. Trichostatin A (TSA), a potent inhibitor of histone deacetylase, derepressed a copy of hph that was repressed by DNA methylation which resulted from repeat-induced point mutation (RIP) acting on sequences flanking hph. Derepression by TSA was comparable to derepression by the inhibitor of DNA methylation, 5-azacytidine. TSA treatment also repressed an allele of am whose expression depends on methylation of an adjacent transposon, Tad. DNA methylation in the hph and Tad/am regions was greatly reduced by TSA treatment. TSA also caused hypomethylation of other methylated alleles of am generated by RIP. In contrast, TSA did not affect methylation of several other methylated genomic sequences examined, including the nucleolar rDNA and the inactivated transposon PuntRIP1. Several possible models are discussed for the observed selective demethylation induced by TSA. The implication that acetylation of chromatin proteins can directly or indirectly control DNA methylation raises the possibility that connections between protein acetylation and DNA methylation result in self-reinforcing epigenetic states.


Figures

Figure 1
Figure 1
Reactivation of silenced hph gene by TSA and 5-AC. N. crassa strain N644 (am132, inl, amRIP/hph/amRIP, mat A) harbors a single copy of the Escherichia coli hph gene that was inactivated by methylation because of the action of RIP on flanking direct repeats of the am gene (23, 26). Sets A and B were from separate experiments using independent solutions and cultures. In each experiment shown, ≈1,000 conidia were plated on each of the plates, 1 μl of TSA (33 mM in dimethyl sulfoxide), 5-AC (20 mM), both, or neither (plates marked − and no hyg) was applied to the paper discs, and, except for the right-most plate in A, hyg was added in 0.7% agar medium after 17–18 hr at 32°C. Control plates with TSA or 5-AC but lacking hyg revealed slight inhibition of growth by TSA and somewhat greater inhibition by 5-AC (not shown).
Figure 2
Figure 2
TSA accentuates silencing of the am gene caused by the adjacent transposon Tad. (A) Approximately 4 × 10⁵ conidia of N. crassa strain N220 (amTad3–2, ure-2, mat a) were plated on permissive (alanine) or restrictive (glycine) sorbose plates. One microliter of TSA (33 mM in dimethyl sulfoxide) was applied to the paper discs and the plates were incubated 3 days at 32°C. The difference in colony density in the portions of the plates not affected by TSA reflects the ratio of Am+ and Am colonies characteristic of this strain. (B) Map of amTad3–2 region of strain N220. Tad (open rectangle) is inserted 70 bp upstream of the transcription start sites (arrow) of am (black rectangle). The approximate methylation status of 15 sites in the region, as determined in a previous study (22), is depicted in black in pie charts placed close to the sites examined. Those sites for BamHI (B), ClaI (C), and EcoRV (V) that are relevant to Fig. 5 are indicated. The bar beneath the map represents a 650-bp XbaI–BamHI fragment used as a probe for the blot shown in Fig. 5.
Figure 3
Figure 3
Effect of TSA on growth and DNA methylation. (A) Liquid cultures inoculated with N. crassa strain N644 (7 × 10⁴ conidia per ml) were supplemented with up to 1 μg/ml (3.3 μM) TSA and grown 27 hr. The untreated culture yielded 32.8 mg of dry tissue. (B) Southern hybridization of selected samples from the cultures. Samples of DNA were prepared and digested with DpnII (D) or Sau3AI (S) and probed for am sequences. Stronger signals in the 0.33 μM lanes is partially due to 2× heavier loadings of DNA in these lanes. The positions of selected size standards (kb) are indicated.
Figure 4
Figure 4
TSA causes selective hypomethylation of DNA. Strain N644 was grown for 2 or 3 days, as indicated, with or without TSA (1 μg/ml; lanes 5–10) and hyg (added to a concentration of 0.1 mg/ml 17 hr after inoculation; lanes 9 and 10). The dry weights of the cultures illustrated were, from left to right, 31.1 mg, 38.5 mg, 37.5 mg, 37.3 mg, and 32.8 mg. DNA was isolated and analyzed by digestion with DpnII (D) or Sau3AI (S) and by probing for am (A), Ψ63 (C), rDNA (D), or hph (not shown). (B) Total genomic DNA visualized by staining with ethidium bromide. The positions of selected size standards (kb) are indicated.
Figure 5
Figure 5
TSA-induced hypomethylation of amTad3–2 and amRIP alleles. Strains containing amTad3-2 (N220), amRIP4 and amRIPec4 [N669 (24)] or amRIP5 and amRIPec5 [N672 (24)] were grown from conidia for 2 days in the presence or absence of 1 μg/ml TSA, as indicated. (A) DNA samples of N220 were digested with EcoRV (which is not inhibited by cytosine methylation) plus BamHI (B), Bsp106I (an isoschizomer of ClaI; C), Sau3AI (S), or DpnII (D) and probed for sequences upstream of Tad (see Fig. 2B). The positions of selected size standards (kb) are indicated. (B) DNA of N669 or N672 was digested with Sau3AI or DpnII and probed sequentially for am, Ψ63 (not shown), and rDNA (not shown).

References

    1. Bird A. Cell. 1992;70:5–8. - PubMed
    1. Kass S U, Pruss D, Wolffe A P. Trends Genet. 1997;13:444–449. - PubMed
    1. Yoder J A, Walsh C P, Bestor T H. Trends Genet. 1997;13:335–340. - PubMed
    1. Selker E U. Trends Genet. 1997;13:296–301. - PubMed
    1. Jaenisch R. Trends Genet. 1997;13:323–329. - PubMed

Publication types

MeSH terms