Time-frequency scaling transformation of the phonocardiogram based of the matching pursuit method
- PMID: 9691572
- PMCID: PMC3515452
- DOI: 10.1109/10.704866
Time-frequency scaling transformation of the phonocardiogram based of the matching pursuit method
Abstract
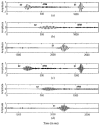
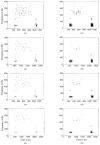
A time-frequency scaling transformation based on the matching pursuit (MP) method is developed for the phonocardiogram (PCG). The MP method decomposes a signal into a series of time-frequency atoms by using an iterative process. The modification of the time scale of the PCG can be performed without perceptible change in its spectral characteristics. It is also possible to modify the frequency scale without changing the temporal properties. The technique has been tested on 11 PCG's containing heart sounds and different murmurs. A scaling/inverse-scaling procedure was used for quantitative evaluation of the scaling performance. Both the spectrogram and a MP-based Wigner distribution were used for visual comparison in the time-frequency domain. The results showed that the technique is suitable and effective for the time-frequency scale transformation of both the transient property of the heart sounds and the more complex random property of the murmurs. It is also shown that the effectiveness of the method is strongly related to the optimization of the parameters used for the decomposition of the signals.
Figures


Similar articles
-
Analysis-synthesis of the phonocardiogram based on the matching pursuit method.IEEE Trans Biomed Eng. 1998 Aug;45(8):962-71. doi: 10.1109/10.704865. IEEE Trans Biomed Eng. 1998. PMID: 9691571
-
Computerized heart sounds analysis.Comput Biol Med. 2008 Feb;38(2):263-80. doi: 10.1016/j.compbiomed.2007.09.006. Epub 2007 Nov 26. Comput Biol Med. 2008. PMID: 18037395
-
Filtering and classification of phonocardiogram signals using wavelet transform.J Med Eng Technol. 2008 Jan-Feb;32(1):53-65. doi: 10.1080/03091900600750348. J Med Eng Technol. 2008. PMID: 18183520
-
Analysis of phonocardiogram signals using wavelet transform.J Med Eng Technol. 2012 Aug;36(6):283-302. doi: 10.3109/03091902.2012.684830. Epub 2012 Jun 28. J Med Eng Technol. 2012. PMID: 22738192 Review.
-
Phonocardiogram signal analysis: a review.Crit Rev Biomed Eng. 1987;15(3):211-36. Crit Rev Biomed Eng. 1987. PMID: 3329595 Review.
Cited by
-
An Intelligent Phonocardiography for Automated Screening of Pediatric Heart Diseases.J Med Syst. 2016 Jan;40(1):16. doi: 10.1007/s10916-015-0359-3. Epub 2015 Oct 30. J Med Syst. 2016. PMID: 26573653
-
Signal processing of heart signals for the quantification of non-deterministic events.Biomed Eng Online. 2011 Jan 26;10:10. doi: 10.1186/1475-925X-10-10. Biomed Eng Online. 2011. PMID: 21269508 Free PMC article.
-
Analysis of the first heart sound using the matching pursuit method.Med Biol Eng Comput. 2001 Nov;39(6):644-8. doi: 10.1007/BF02345436. Med Biol Eng Comput. 2001. PMID: 11804170
-
Detection of the valvular split within the second heart sound using the reassigned smoothed pseudo Wigner-Ville distribution.Biomed Eng Online. 2013 Apr 30;12:37. doi: 10.1186/1475-925X-12-37. Biomed Eng Online. 2013. PMID: 23631738 Free PMC article.
-
Detecting Aortic Valve-Induced Abnormal Flow with Seismocardiography and Cardiac MRI.Ann Biomed Eng. 2020 Jun;48(6):1779-1792. doi: 10.1007/s10439-020-02491-3. Epub 2020 Mar 16. Ann Biomed Eng. 2020. PMID: 32180050 Free PMC article.
References
-
- Abrams J. Current concepts of the genesis of heart sounds II. Third and fourth sounds. JAMA. 1978;239:2029–2030. - PubMed
-
- Abrams J. Cardiac auscultation: The Stethoscope and Cardiac Sound. In: Abrams J, editor. Essentials of Cardiac Physical Diagnosis. Philadelphia, PA: Lea & Febiger; 1987.
-
- Durand LG, Pibarot P. Digital signal processing of the phonocardiogram: Review of the most recent advancements. CRC Crit Rev Biomed Eng. 1995;23:163–219. - PubMed
-
- Leatham A. Auscultation of the Heart and Phonocardiography. 2. London, U.K: Churchill Livingstone; 1975.
-
- Lee FF. Time-compression and expansion of speech by the sampling method. In: Lim JS, editor. Speech Enhancement. Cambridge, MA: Massachusetts Inst. Technol; 1983. pp. 286–290.
Publication types
MeSH terms
LinkOut - more resources
Full Text Sources
Other Literature Sources

