. 1998 Aug 1;12(15):2381-91.
doi: 10.1101/gad.12.15.2381.

The ROTUNDIFOLIA3 gene of Arabidopsis thaliana encodes a new member of the cytochrome P-450 family that is required for the regulated polar elongation of leaf cells

Affiliations

The ROTUNDIFOLIA3 gene of Arabidopsis thaliana encodes a new member of the cytochrome P-450 family that is required for the regulated polar elongation of leaf cells

G T Kim et al. Genes Dev. .

Abstract

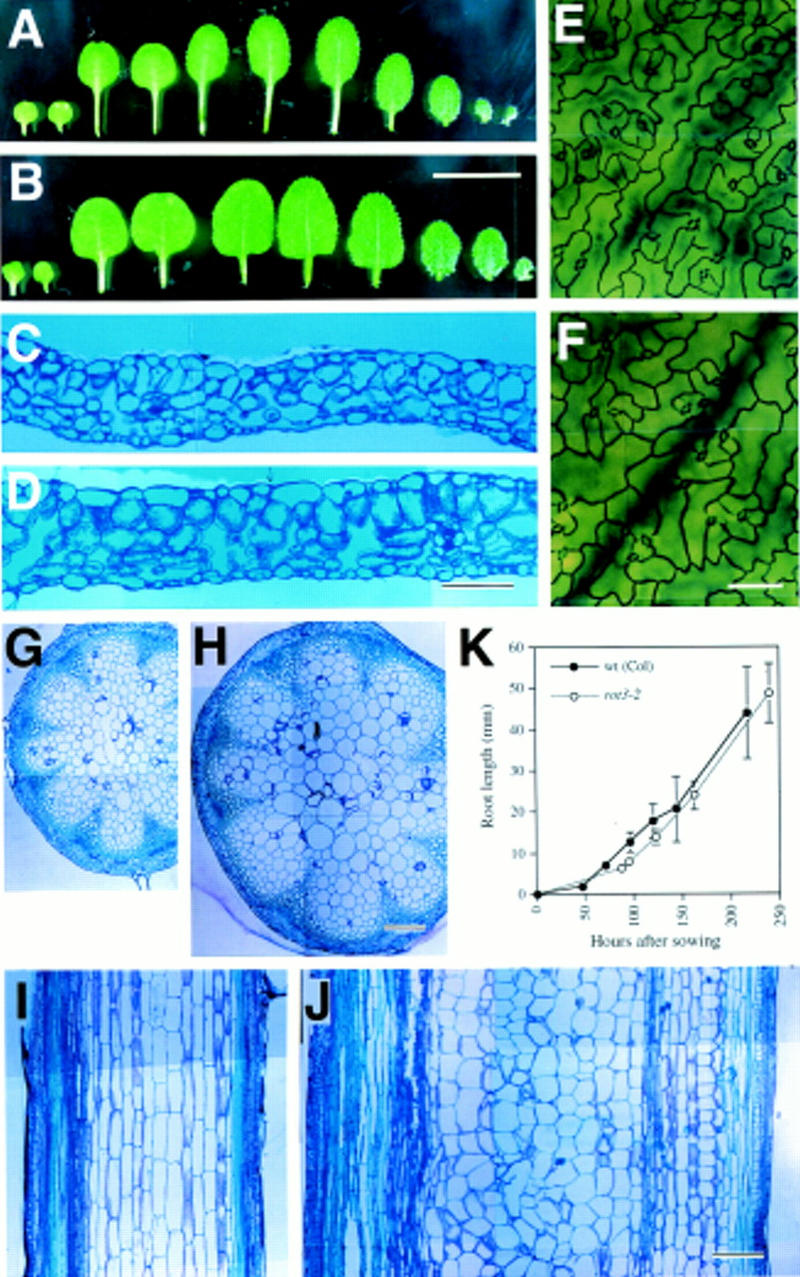
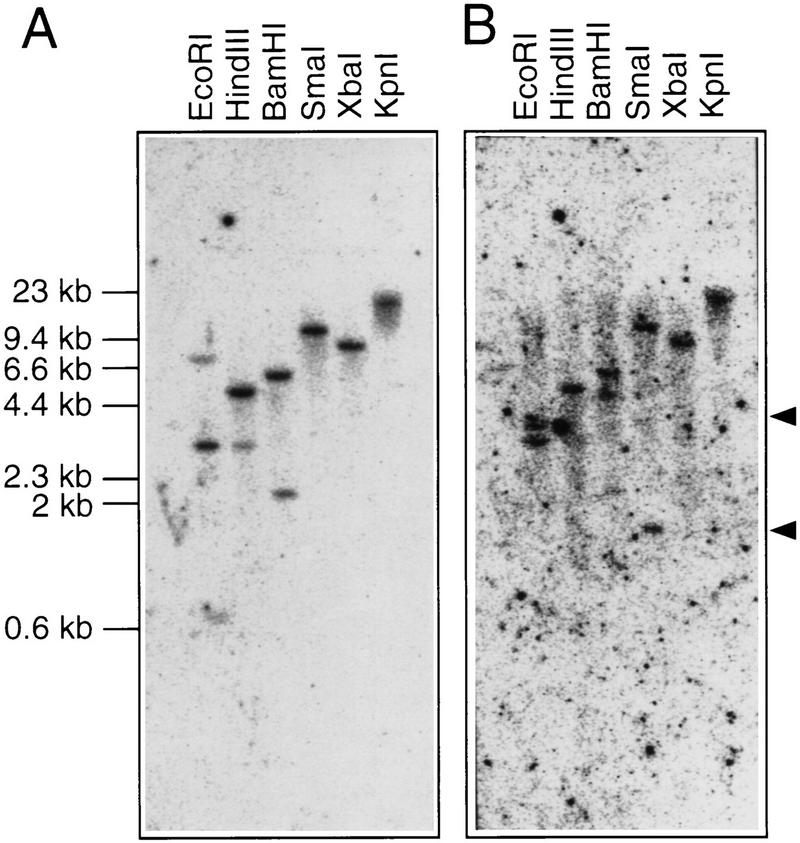
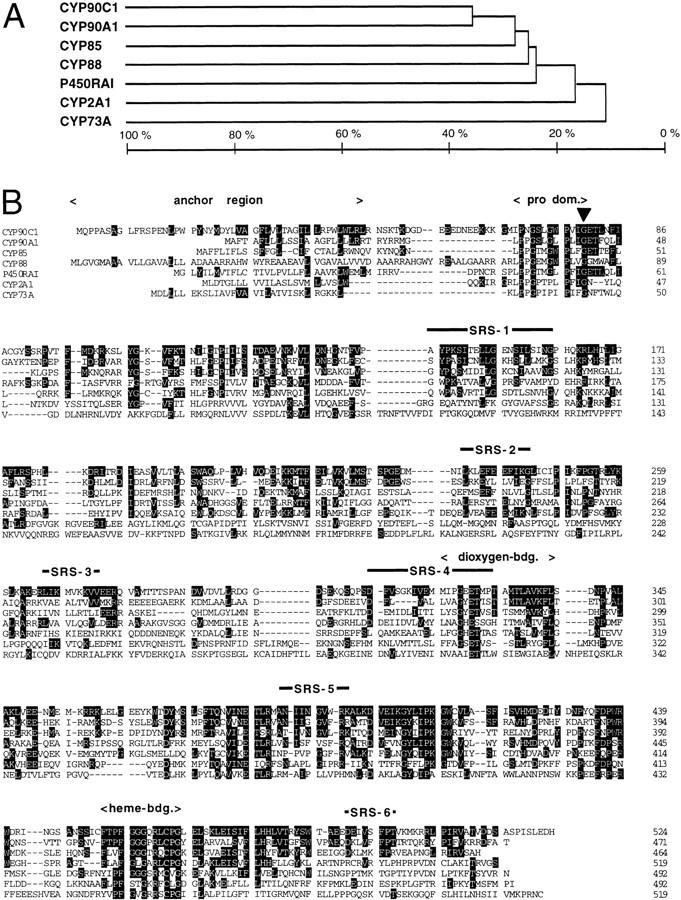
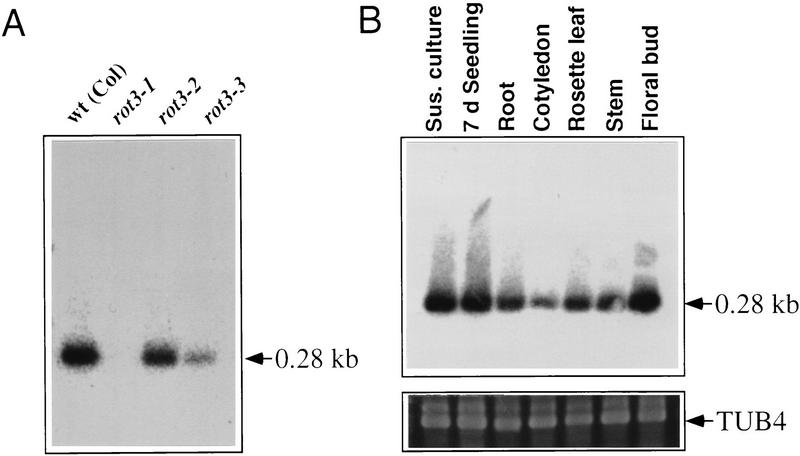
The polarized processes of cell elongation play a crucial role in morphogenesis of higher plants. We reported previously that the rotundifolia3 (rot3) mutant of Arabidopsis has a defect in the polar elongation of leaf cells. In the present study, we isolated two additional alleles with mutations in the ROT3 gene. The ROT3 gene was cloned by a T-DNA-tagging method and isolation of the gene was confirmed by a molecular analysis of three rot3 mutant alleles obtained from different mutagenesis. The ROT3 gene encodes a cytochrome P-450 (CYP90C1) with domains homologous to regions of steroid hydroxylases of animals and plants. Expression of the ROT3 gene was detected in all major plant organs. Especially, higher expression was detected in the tissues that had high activity of cell division. We confirmed that the ROT3 gene controls polar elongation specifically in leaf cells by an analysis of three rot3 mutants obtained from different mutagenesis experiments. Our results imply that the ROT3 protein is a member of a new class of cytochrome P-450 encoding putative steroid hydroxylases, which is required for the regulated polar elongation of cells in leaves of Arabidopsis.


Figures

Figure 1
Figure 1
Morphology of wild-type and rot3 mutant plants. (A–D) Photographs of wild-type (A), rot3-1 (B), rot3-2 (C), and rot3-3 (D) plants are shown. (E–G) The morphology of heterozygotes from the following crosses: rot3-1 × rot3-2 (E), rot3-1 × rot3-3 (F), and rot3-2 × rot3-3 (G). The plants were photographed 4 weeks after sowing of seeds. Bars, 10 mm.
Figure 2
Figure 2
Phenotypes of wild-type and rot3-2 mutant plants. (A,B) Leaves of the wild type (A) and the rot3-2 mutant (B). The leaves in each row are, from the left, the two cotyledons and the rosette leaves from 3-week-old plants. (C,D) Transverse sections of the fifth rosette leaves of wild-type (B) and rot3-2 (C) plants at the stage when leaves were fully expanded. (E,F) Epidermal cells on the adaxial surface of a wild-type (E) and a rot3-2 (F) leaf that was collected when fully expanded. Bar, 100 μm. (G–J) Transverse sections of internodes of wild-type (G) and rot3-2 (H) plants, and longitudinal sections of internodes of wild-type (I) and rot3-2 (J) plants. The sections were prepared from mature plants. Bars, 200 μm. (K) Growth of roots of wild-type and rot3-2 plants. (See text for details.)
Figure 3
Figure 3
Physical map of the ROT3 locus and transcription of the wild-type gene. (A) Schematic map of the T-DNA-tagged rot3 gene. An arrow indicates the promoter sequence of the ROT3 gene. Recognition sites for restriction endonucleases BamHI (B), EcoRI (E), and HindIII (H) are shown on the map. (B) Southern genomic DNA hybridization analysis of wild-type (wt) and rot3 alleles. Genomic DNA was digested with EcoRI and fragments after electrophoresis were allowed to hybridize with probe D shown in A. The hybridization pattern of rot3-1 indicates a deletion in the promoter and the first exon–intron region of the ROT3 locus. (C) RNA blot hybridization analysis of the wild-type plant 4 weeks after sowing. Hybridization of 1.5 μg of poly(A)+ RNA with probe B shown in A. The result indicated that the transcribed RNA was 1.8 kb long. The membrane was exposed to an imaging plate for 1 week, and the band was visualized by an image analyzer (BAS1000; Fujix, Tokyo, Japan).
Figure 3
Figure 3
Physical map of the ROT3 locus and transcription of the wild-type gene. (A) Schematic map of the T-DNA-tagged rot3 gene. An arrow indicates the promoter sequence of the ROT3 gene. Recognition sites for restriction endonucleases BamHI (B), EcoRI (E), and HindIII (H) are shown on the map. (B) Southern genomic DNA hybridization analysis of wild-type (wt) and rot3 alleles. Genomic DNA was digested with EcoRI and fragments after electrophoresis were allowed to hybridize with probe D shown in A. The hybridization pattern of rot3-1 indicates a deletion in the promoter and the first exon–intron region of the ROT3 locus. (C) RNA blot hybridization analysis of the wild-type plant 4 weeks after sowing. Hybridization of 1.5 μg of poly(A)+ RNA with probe B shown in A. The result indicated that the transcribed RNA was 1.8 kb long. The membrane was exposed to an imaging plate for 1 week, and the band was visualized by an image analyzer (BAS1000; Fujix, Tokyo, Japan).
Figure 4
Figure 4
Southern genomic DNA hybridization analysis of the ROT3 gene. (A,B) Two blots with similar sets of restriction fragments of genomic DNA were allowed to hybridize with 32P-labeled ROT3 cDNA with high-stringency conditions (A) and with low-stringency conditions (B) for hybridization and washing (see Materials and Methods for details). Note the presence of additional bands (B, arrowhead) after hybridization and washing under low-stringency conditions.
Figure 5
Figure 5
Phylogenetic tree (A) and alignment of amino acid sequences of CYP90C1 and other cytochrome P-450s from plants and animals (B). CYP90C1 exhibits strong homology to CYP90A1 (36%; cathasterone C23 hydroxylase of A. thaliana), CYP85 (27%; DWARF protein of tomato), CYP88 (25%; GA12-GA53 gibberellin 13-hydroxylase of maize), and P-450-RAI (23%; retinoic acid 4-hydroxlase of zebrafish). CYP2A1 (rat hepatic steroid hydroxylase) is also homologous to CYP90C1 in the SRSs (SRS-1–SRS-6), indicated above the aligned sequences. The mutation site of ROT3-2 (Gly-80 to Glu) is marked by an inverted black triangle in the conserved proline-rich region (pro dom.). The locations of conserved domains of microsomal P-450s, including the membrane anchor region, the proline-rich domain, and the O2-, steroid-, and heme-binding domains, are indicated above the aligned sequences. Identical amino acids are indicated as white letters in black boxes. Bar in A indicates percentage of homology to CYP90C1.
Figure 6
Figure 6
Amplification by RT–PCR of ROT3 mRNA with primers pROT3-1 and pROT3-2. Total RNA was used for RT–PCR. Amplified DNAs were allowed to hybridizae with 32P-labeled ROT3 cDNA with high-stringency conditions for hybridization and washing. Arrows indicate 0.28-kb products of PCR. (A) Expression of wild-type and rot3 alleles. Total RNA was isolated from 4-week-old leaves. One microgram of total RNA was used in each case. (B) Expression of the mRNA in various tissues of Arabidopsis. Total RNA was isolated from suspension cultured cells, 7-day-old seedling, root, cotyledon, rosette leaf, stem, and floral bud. Two micrograms of total RNA was used in each case. Result for amplification by RT–PCR of β-tubulin4 (TUB4) fragments was shown for standard controls (B; bottom).

References

    1. Altschul SF, Lipman DJ. Protein database searches for multiple alignments. Proc Natl Acad Sci. 1990;87:5509–5513. - PMC - PubMed
    1. Bishop GJ, Harrison K, Jones JDG. The tomato Dwarf gene isolated by heterologous transposon tagging encodes the first member of a new cytochrome P450 family. Plant Cell. 1996;8:959–969. - PMC - PubMed
    1. Chen C-D, Kemper B. Different structural requirements at specific proline residue positions in the conserved proline-rich region of cytochrome P450 2C2. J Biol Chem. 1996;271:28607–28611. - PubMed
    1. Chen C-D, Doray B, Kemper B. A conserved proline-rich sequence between the N-terminal signal-anchor and catalytic domains is required for assembly of functional cytochrome P450 2C2. Arch Biochem Biophys. 1998;350:233–238. - PubMed
    1. Chory J, Negpal P, Peto CA. Phenotypic and genetic analysis of det2, a new mutant that affects light-regulated seedling development in Arabidopsis. Plant Cell. 1991;3:445–459. - PMC - PubMed

Publication types

MeSH terms

Associated data