. 1998 Sep;72(9):7181-90.
doi: 10.1128/JVI.72.9.7181-7190.1998.

The neural cell adhesion molecule is a receptor for rabies virus

Affiliations

The neural cell adhesion molecule is a receptor for rabies virus

M I Thoulouze et al. J Virol. 1998 Sep.

Abstract

Previous reports strongly suggest that, in addition to the nicotinic acetylcholine receptor, rabies virus can use other, as-yet-unidentified receptors. We found that laboratory cell lines susceptible to rabies virus infection express the neural cell adhesion molecule (NCAM) (CD56) on their surface, whereas resistant cells do not, supporting the idea that NCAM could be a rabies virus receptor. We observed that (i) incubation with rabies virus decreases the surface expression of NCAM; (ii) treatment of susceptible cells with heparan sulfate, a ligand for NCAM, or with NCAM antibodies significantly reduces the rabies virus infection; and (iii) preincubation of rabies virus inoculum with soluble NCAM protein as a receptor decoy drastically neutralizes the capacity of rabies virus to infect susceptible cells. Moreover, we demonstrated that transfection of resistant L fibroblasts with the NCAM-encoding gene induces rabies virus susceptibility whereas absence of NCAM in the primary cortical cell cultures prepared from NCAM-deficient mice reduces the rabies virus infection and virus production. This provides evidence that NCAM is an in vitro receptor for the rabies virus. Moreover, the in vivo relevance for the use of NCAM as a receptor was demonstrated by the infection of NCAM-deficient mice, in which rabies mortality was delayed and brain invasion by rabies virus was drastically restricted. Our results showed that NCAM, which is expressed mainly in the adult nervous system, plays an important role in rabies infection. However, it cannot be excluded that receptors other than NCAM are utilized. Thus, the description of NCAM as a new rabies virus receptor would be another example of the use by viruses of more than one receptor to gain entry into the host.


Figures

FIG. 1
FIG. 1
RV modulates NCAM expression on the cell surface. Modulation by RV of the amount of NCAM on the cell surface of BSR (A and B) and N2a (C and D) cells was analyzed by cytofluorimetry. BSR cells were either mock treated (incubation with medium alone) (solid bold line) or treated with 10 (dashed line) or 30 (solid line) PFU of RV per cell (A) or with 10 PFU of vaccinia virus per cell (dotted line) as control virus (B). The samples were then incubated with anti-NCAM MAb or culture medium (peak on the extreme left) followed by FITC-conjugated anti-mouse IgG. The specificity of NCAM modulation by RV was tested by using N2a cells, which express both NCAM and α6 chain of integrin (C and D). N2a cells were either mock treated (solid line) or treated (dotted line) with 10 PFU of RV per cell and then anti-NCAM MAb (C) or an anti-α6 chain of integrin MAb (D) or culture medium (left peak in diagrams) followed by FITC-conjugated anti-mouse IgG Ab. Values are representative of five independent experiments.
FIG. 2
FIG. 2
Glycosaminoglycans (A) and anti-NCAM Abs (B) inhibit RV infection. (A) NCAM-negative (L cells) and NCAM-positive (BSR and N2a) cell monolayers were incubated for 30 min at 37°C with 10 μg of heparan sulfate (black bars) or chondroitin sulfate A (dark gray bars), B (light gray bars), or C (white bars) per ml. (B) NCAM-positive (N2a) cell monolayers were incubated for 30 min at 4°C with 5 μg of MAb directed against the α6 chain of integrin (MAb CD49f) per ml, rabbit serum directed against recombinant soluble NCAM protein, or their respective controls. NCAM-positive (BSR) cell monolayers were incubated with increasing doses of anti-NCAM (H28) MAb (5 to 20 μg/ml) or isotype control MAb. After ligand or Ab treatment, cells were inoculated with RV and infection was estimated as the percentage of NC-positive cells 18 h postinfection. The percentage of inhibition of infection was calculated thus: 100 × (percentage of infected cells in the control − percentage of infected cells in the assay)/(percentage of infected cells in the control). Values are the means of three independent experiments ± standard deviations.
FIG. 3
FIG. 3
Soluble recombinant NCAM protein neutralizes RV infection. RV and vaccinia virus inocula were incubated with 0.7 to 1 μg of soluble NCAM or with control proteins (irrelevant Ig domain and laminin) for 40 min at 37°C. The effect of the different treatments was estimated by measuring the residual infectious virus expressed as a percentage of BSR cells infected after 18 h of culture (left part for RV and right part for vaccinia virus). Values are the means of four separate experiments ± standard deviations.
FIG. 4
FIG. 4
Characteristics of NCAM-transfected cells. Expression of NCAM was analyzed by Western blotting and cytofluorimetry in N2a, NCAM-negative L cells transfected with either the plasmid (control cells) or NCAM-180 (D9 cells) or NCAM-140 (A14 cells) isoform cDNA, with a MAb directed against an epitope common to the three NCAM isoforms. The solid line indicates the fluorescence profile obtained with NCAM MAb. The left peak represents FITC-conjugated secondary Ab binding. Bars and numbers represent the gated regions and percentages of cells expressing NCAM, respectively.
FIG. 5
FIG. 5
RV susceptibility of transfected NCAM cells. (A and B) Two-day cultures of RV-infected N2a, NCAM-transfected (D9 and A14), and NCAM-negative (control) cells were double stained for NCAM (red) and viral NC (green) and examined by microscopy (A) or analyzed by flow cytometry (B). RV-infected NCAM-positive cells appear as yellow-stained cells in the leftmost A panels and are located in the upper right quadrant in the B panels. (C) RV susceptibility of D9 (dashed curve), A14 (solid black curve), and control (dotted curve) cells was assessed by infection with RV (MOI of 1.5 to 0.25). Results are expressed as the percentages of cells infected 48 h after infection. (D) Inhibition of RV infection of control, D9, A14, and N2a cells by heparan sulfate and chondroitin sulfate A and B (left, middle, and right bars in each set, respectively).
FIG. 5
FIG. 5
RV susceptibility of transfected NCAM cells. (A and B) Two-day cultures of RV-infected N2a, NCAM-transfected (D9 and A14), and NCAM-negative (control) cells were double stained for NCAM (red) and viral NC (green) and examined by microscopy (A) or analyzed by flow cytometry (B). RV-infected NCAM-positive cells appear as yellow-stained cells in the leftmost A panels and are located in the upper right quadrant in the B panels. (C) RV susceptibility of D9 (dashed curve), A14 (solid black curve), and control (dotted curve) cells was assessed by infection with RV (MOI of 1.5 to 0.25). Results are expressed as the percentages of cells infected 48 h after infection. (D) Inhibition of RV infection of control, D9, A14, and N2a cells by heparan sulfate and chondroitin sulfate A and B (left, middle, and right bars in each set, respectively).
FIG. 6
FIG. 6
RV infection of primary cortical cultures from NCAM-deficient and wild-type mice. Three-day cortical cell cultures prepared from postnatal wild-type or NCAM-deficient mice were infected with CVS at an MOI of 10 and cultivated for 3 more days. Percentages of infected cells (A) and virus production per cell in culture (B) were determined for 11 NCAM-positive and 7 NCAM-negative cortical cell cultures. NCAM-positive and NCAM-negative cortical cell cultures were tested for NCAM expression by allele-specific PCR analysis and by immunocytochemistry with an anti-NCAM MAb. Horizontal bars indicate the mean values for infection and virus production per a definite number of cells in culture ± standard deviations.
FIG. 7
FIG. 7
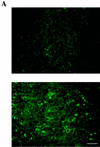
RV infection and mortality in NCAM-deficient mice. (A and B) RV infection in the brains of wild-type and NCAM-deficient mice, 6 days after inoculation of the masseter muscle, was assessed by detecting RV NC by immunofluorescence (A) and N protein by immunocapture ELISA (B). (A) RV infection in cortex sagittal slices of NCAM-deficient (top) and wild-type (bottom) mice with FITC-conjugated anti-NC Ab. Bars represent 5 μm. (B) Production of RV N protein in three parts of the brain, cerebellum plus brain stem, diencephalon, and cortex, of wild-type (black bars) and NCAM-deficient (gray bars) mice. Numbers represent the N protein concentrations (picograms per milliliter) of tissue suspension. (C) Day of death according to the phenotype of mice. The mean day of death was 10.2 for the wild-type group and 13.6 for the NCAM-deficient group. Each group included eight animals. The difference was significant (P = 0.002).
FIG. 7
FIG. 7
RV infection and mortality in NCAM-deficient mice. (A and B) RV infection in the brains of wild-type and NCAM-deficient mice, 6 days after inoculation of the masseter muscle, was assessed by detecting RV NC by immunofluorescence (A) and N protein by immunocapture ELISA (B). (A) RV infection in cortex sagittal slices of NCAM-deficient (top) and wild-type (bottom) mice with FITC-conjugated anti-NC Ab. Bars represent 5 μm. (B) Production of RV N protein in three parts of the brain, cerebellum plus brain stem, diencephalon, and cortex, of wild-type (black bars) and NCAM-deficient (gray bars) mice. Numbers represent the N protein concentrations (picograms per milliliter) of tissue suspension. (C) Day of death according to the phenotype of mice. The mean day of death was 10.2 for the wild-type group and 13.6 for the NCAM-deficient group. Each group included eight animals. The difference was significant (P = 0.002).

Similar articles

Cited by

References

    1. Alcaraz G, Goridis C. Biosynthesis and processing of polysialylated NCAM by AtT-20 cells. Eur J Cell Biol. 1991;55:165–173. - PubMed
    1. Atkinson J P, Krych M, Nickells M, Birmingham D, Subramanian V B, Clemenza L, Alvarez J, Liszewski K. Complement receptors and regulatory proteins: immune adherence revisited and abuse by microorganisms. Clin Exp Immunol. 1994;2:1–3. - PMC - PubMed
    1. Beggs H E, Baragona S C, Hemperly J J, Maness P F. NCAM140 interacts with the focal adhesion kinase p125(fak) and the SRC-related tyrosine kinase p59(fyn) J Biol Chem. 1997;272:8310–8319. - PubMed
    1. Broughan J H, Wunner W H. Characterization of protein involvement in rabies virus binding to BHK-21 cells. Arch Virol. 1995;140:75–93. - PubMed
    1. Cole G J, Akeson R. Identification of a heparin binding domain of the neural cell adhesion molecule N-CAM using synthetic peptides. Neuron. 1989;2:1157–1165. - PubMed

Publication types

MeSH terms