. 1998 Aug 15;18(16):6113-25.
doi: 10.1523/JNEUROSCI.18-16-06113.1998.

alpha-Latrotoxin alters spontaneous and depolarization-evoked quantal release from rat adrenal chromaffin cells: evidence for multiple modes of action

Affiliations

alpha-Latrotoxin alters spontaneous and depolarization-evoked quantal release from rat adrenal chromaffin cells: evidence for multiple modes of action

J Liu et al. J Neurosci. .

Abstract

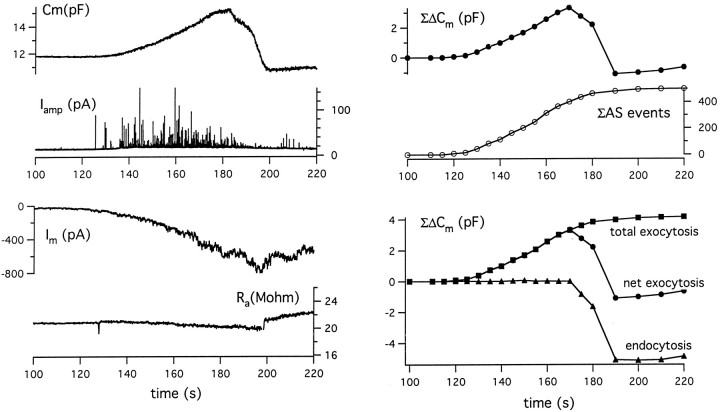
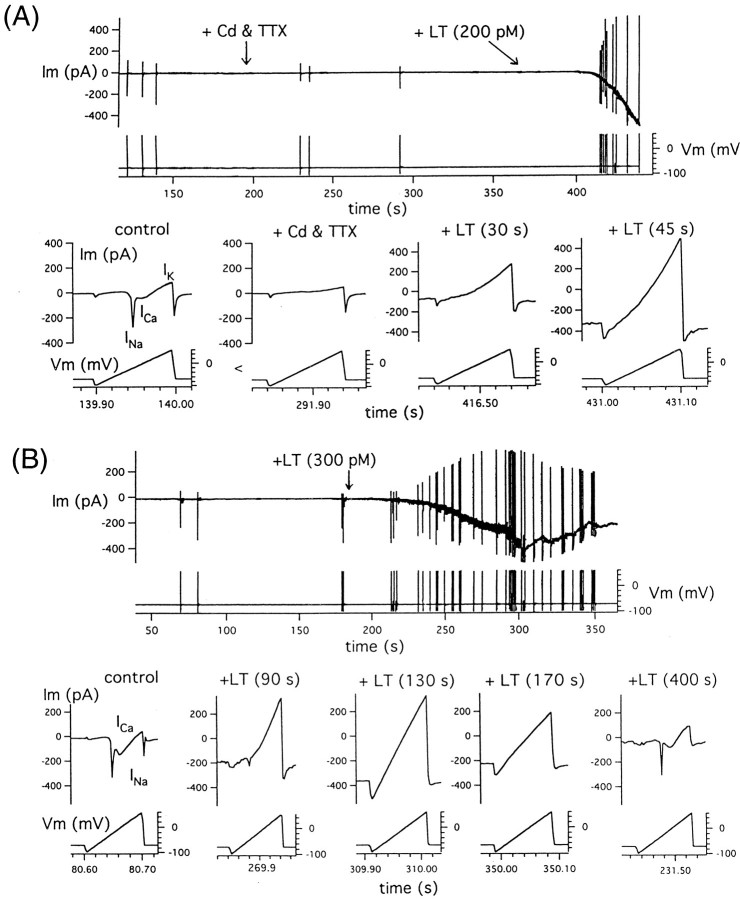
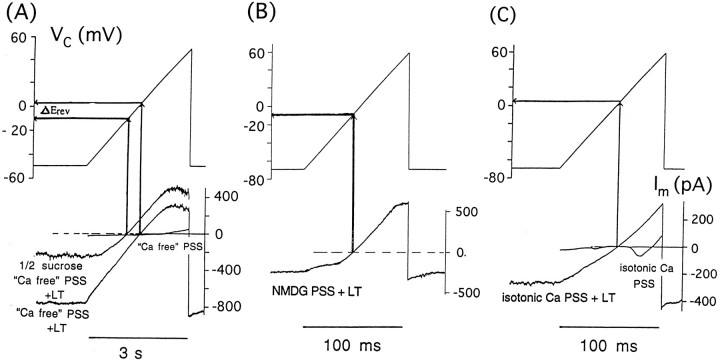
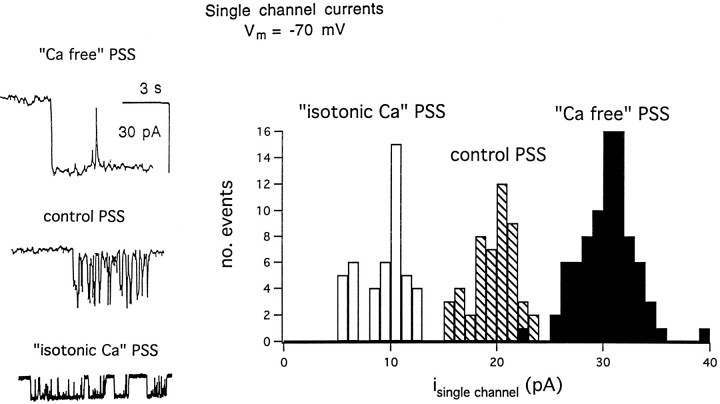
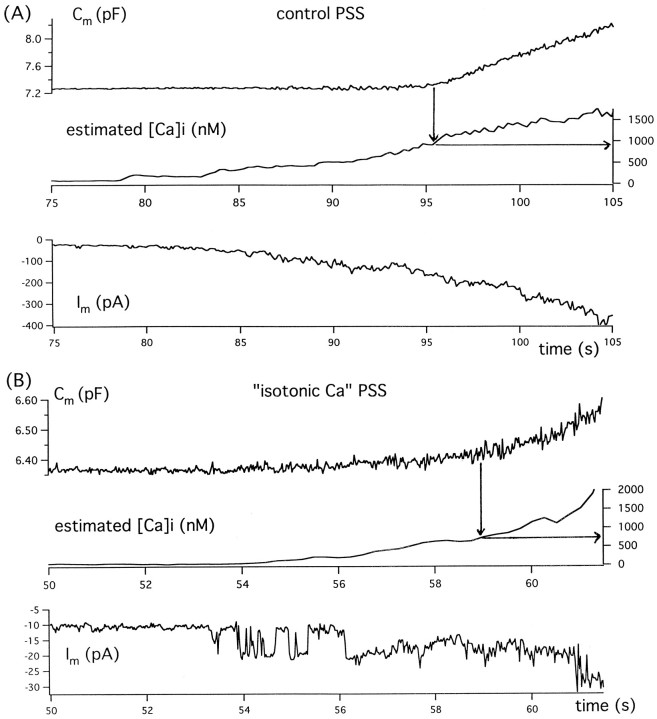
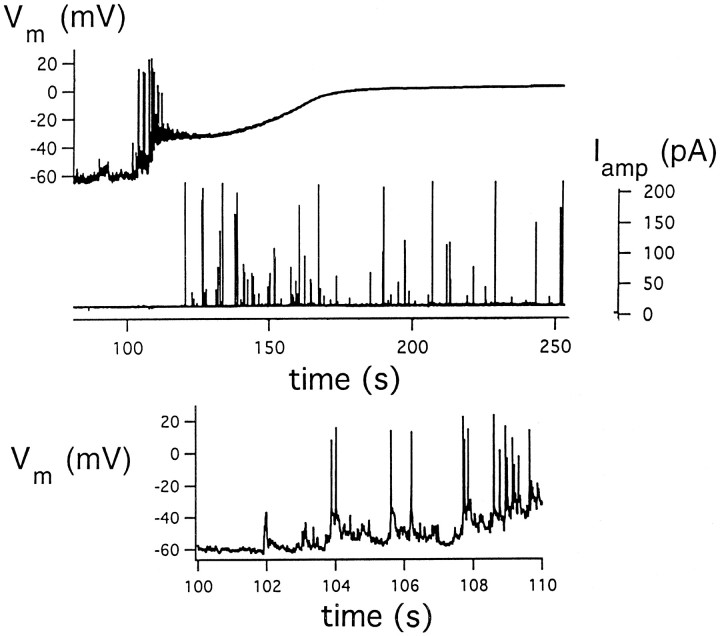
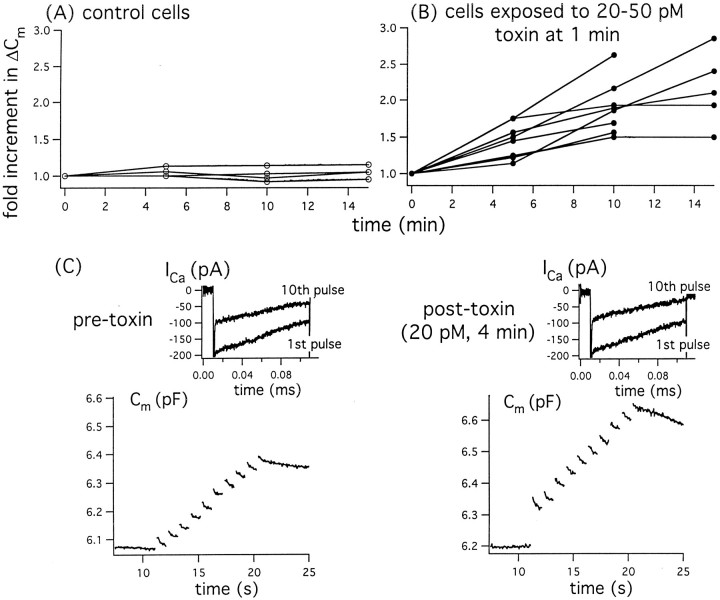
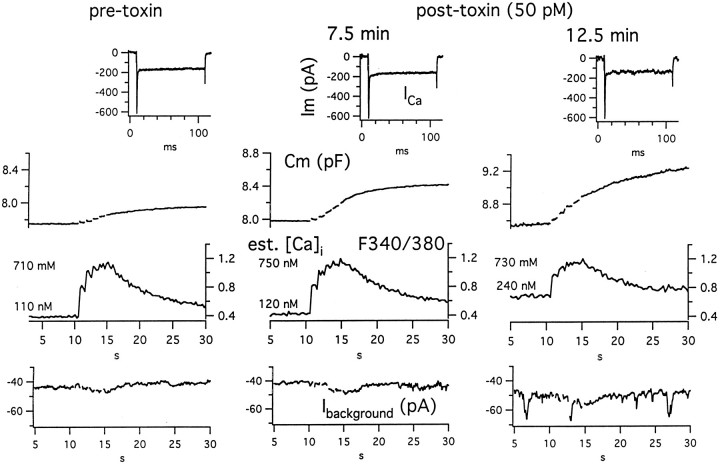
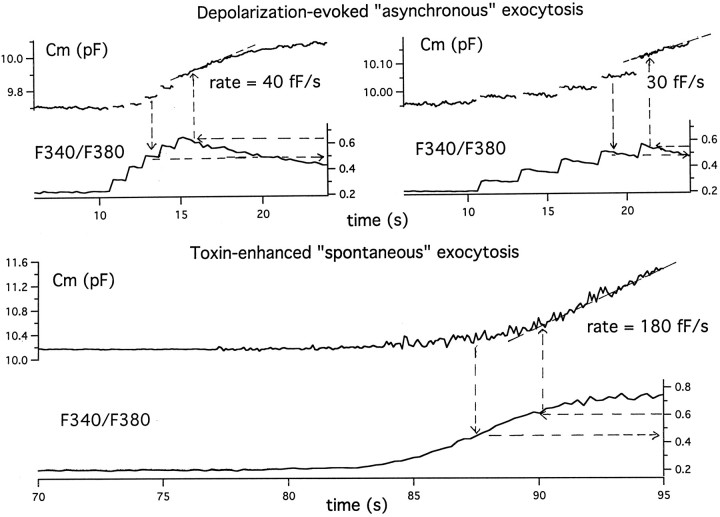
alpha-Latrotoxin (alpha-LT) potently enhances both "spontaneous" and "depolarization-evoked" quantal secretion from neurons. Here we have used the patch-clamped rat adrenal chromaffin cell to examine simultaneously the effects of alpha-LT on membrane current or voltage, cytosolic Ca, and membrane capacitance, the latter used as an assay for exocytosis. In chromaffin cells exposed to toxin concentrations of >100 pM, the development of large conductance, Ca-permeable ion channels, accompanied by a rise in cytosolic Ca to levels near 1 microM, precedes the initiation of spontaneous exocytosis. These channels appear to be induced de novo, because they occur concurrently with massive reduction or pharmacological block of voltage-dependent Na and Ca currents. However, enhancement of depolarization-evoked release, seen in many cells at <50 pM toxin, often occurs in the absence of a rise in background cytosolic Ca or de novo channel activity. These results favor Ca entry through toxin-induced channels underlying initiation of spontaneous release and direct modulation of the secretory machinery by the toxin-bound receptor contributing to enhancement of depolarization-evoked secretion as well as spontaneous release.


Figures

Fig. 1.
Fig. 1.
Simultaneous monitoring of secretory response to α-LT by capacitance tracking and amperometry permits estimation of time courses of exocytosis and endocytosis. Left, Time courses of membrane capacitance (Cm), amperometric current events (Iamp), membrane current (Im), and access resistance (Ra) recorded from patch-clamped chromaffin cells held at −70 mV beginning 30 sec after the addition of 500 pm α-LT to the bath. Note thatRa remained stable throughout the depicted time interval, thus reducing chances of a “cross-talk” artifact between changing membrane resistance andCm, especially when membrane resistance is <100 MΩ. Upper Right, Comparison of time course of ΔCm and the running sum of amperometrically detected quantal release events. Lower Right, Estimates of time course of total exocytosis, net exocytosis, and endocytosis after addition of toxin. See Results for details of computation.
Fig. 2.
Fig. 2.
Toxin-induced current develops in the face of previous or concurrent drastic reduction in voltage-dependent sodium and calcium currents. A, The time course of development of toxin-induced current after addition of TTX and Cd that pharmacologically block Na and Ca currents, respectively, is shown.B, The initial drastic reduction of voltage-dependent currents, after application of toxin, coincides with the initial development of toxin-induced current, whereas the slow return of voltage-dependent current coincides with the subsequent waning of toxin-induced current. Membrane current was probed by intermittent imposition of voltage ramp (−100 to +60 mV over 100 msec) before and after development on toxin-induced inward current seen at −70 mV. In the bottom panels of A andB, expanded traces recorded at indicated times, except for the last trace in Bthat was recorded 3 min later as part of a different data file, are presented.
Fig. 3.
Fig. 3.
Survey of ion permeability via α-LT–induced membrane conductance. Currents were recorded in response to voltage ramps 60–90 sec after the application of toxin to different cells bathed in Ca-free PSS and in modified Ca-free PSS in which 65 mm NaCl was replaced isosmotically with sucrose (A), in Ca-free PSS in which Na and K (all but 3 mm) were replaced with NMDG (B), and in isotonic-Ca PSS (C). See Results for general overview. Two specific points deserve clarification. (1) Current–voltage relationships seen before application of toxin are shown for Ca-free PSS and isotonic-Ca PSS to eliminate nonspecific effects in these unusual solutions. The lack of voltage-dependent Ca current in Ca-free PSS is attributed to an external Ca of <10 μm; the lack of Na current is attributed to a partial block by TTX and partial inactivation by a maintained holding potential of −50 mV. After toxin application, the “turn-down” in outward current at very positive membrane potentials may reflect closure of toxin channels through a flickery subconductance state. Such a phenomenon was observed after application of the 10 nmtoxin to one side of a lipid bilayer bathed in 150 mm KCl (W. German and S. Misler, unpublished observations). In the isotonic-Ca PSS, note that voltage-dependent Ca current peaks at approximately +30 mV, because of the elevated bath Ca and shifts in the activation curve of the high voltage-activated Ca channels. (2)Erev denotes the observed reversal potential of toxin-induced current in each condition. Because in each case, the liquid junction potentials (LJP) were zeroed before patching the cell, the shift in Erev can be used to assess the relative permeability of ions, although in each case we calculate that the observed Erev is shifted positively by 8 mV from the true Erev because of partial undoing of the LJP correction after seal formation.
Fig. 4.
Fig. 4.
Single-channel currents induced by the toxin.Left, Sample traces of the first distinct signs of toxin-induced channel activity recorded after toxin application at a holding potential of −70 mV in three ionic conditions: Ca-free PSS, control PSS, and isotonic-Ca PSS.Right, Histogram of single-channel current amplitudes recorded under these three conditions.
Fig. 5.
Fig. 5.
Temporal relationship of toxin-induced exocytosis, measured as an increase in membrane capacitance, to toxin-induced channel activity and the rise in cytosolic Ca seen at near-physiological versus near-isotonic extracellular Ca concentrations. A, Results obtained in control PSS after addition of 200 nm toxin at 30 sec. B, Results obtained in isotonic-Ca PSS after addition of 200 nm toxin at 20 sec. Note that in both ionic conditions, the onset of exocytosis (noted by an arrow) follows a rise in cytosolic Ca to ∼1 μm. However, membrane current flow and total charge transfer preceding this rise are clearly many fold greater in control PSS than in isotonic-Ca PSS.
Fig. 6.
Fig. 6.
Time course of membrane excitability and quantal release of current-clamped chromaffin cells treated with toxin.Top, Simultaneous recordings of membrane potential (Vm) and amperometric currents (Iamp) beginning 10 sec after application of 150 pm toxin. Bottom, Expanded Vm trace over the interval in which electrical activity commences.
Fig. 7.
Fig. 7.
Exposure to small doses of toxin results in progressive increases in depolarization-evoked quantal release even in the absence of changes in voltage-dependent Ca current.A, B, Tabulated results of sets of experiments in which ΔCm and membrane current were measured in response to 10 depolarizations of 200 msec (from −70 to +10 mV at 1 Hz) at intervals in control cells (A) and in test cells before and again at intervals after application of 20–50 pm toxin (B). C, Sample datatraces from a representative cell before and then 4 min after exposure to 20 pm toxin.Insets show, with expanded scales, Ca currents recorded in response to the 1st and 10th depolarizing pulses from −70 to +10 mV. The larger Na+ currents, whose peak values remained constant at −820 pA, are truncated in thesetraces.
Fig. 8.
Fig. 8.
Simultaneous monitoring of effects of toxin on baseline and depolarization-evoked changes in membrane capacitance (Cm) and cytosolic Ca (in this figure given as the ratio of fluorescence emission after excitation at 340 and 380 nm, i.e.,F340/F380). Background membrane current (Ibackground) and depolarization-evoked currents are also shown. Left, Pretoxin data; Middle, Right, Post-toxin data at 7.5 and 12.5 min, respectively. Note that the 2.5-fold increase in exocytotic response to the depolarizing train seen 7.5 min after addition of toxin is accompanied by a <10% increase in background fluorescence ratio (and estimated cytosolic Ca) and only a 5% rise in the peak level of the fluorescence ratio (and estimated cytosolic Ca) over those in the control period. However, the further increase in exocytotic response observed at 12.5 min after addition of toxin occurs in the presence of a sustained rise in background cytosolic Ca but not in the peak level of cytosolic Ca. In fact, at 12.5 min, the summed Ca entry during the train was ∼20% less than that at 7.5 min, because of the initially smaller Ca current and its faster “run-down” with repeated activity. The discrete steps seen in background current (Ibackground) at 12.5 min most likely represent short-lived openings of toxin-induced ion channels. Note at each time point that the first Cm response within the train was primarily a step-like change, whereas the responses to subsequent depolarizations took on a creeping component that at 7.5 and 12.5 min ultimately dominated the response and continued for several seconds.
Fig. 9.
Fig. 9.
Toxin-enhanced spontaneous exocytosis has a similar threshold value of [Ca]i but occurs at a faster rate than does asynchronous exocytosis accompanying trains of depolarization measured in the same cell. Top, This cell was subjected to two trains of five 100 msec depolarizations to +10 mV, first at 1 Hz and later at 0.5 Hz, and changes inCm and cytosolic Ca were monitored.Bottom, Then 1 nm toxin was added, and these parameters were again monitored. In the case of depolarization-evoked release, the Ca threshold was determined as the peak Ca level associated with the first response in the train to show distinct capacitance creep (see broken arrows downwardand to the right). In the case of toxin-enhanced “spontaneous exocytosis,” the Ca threshold was determined as the mean value of Ca over the range in whichCm first averaged 100 fF above a stable baseline. This criterion was chosen because in most experiments an increase in background membrane conductance caused by toxin was reflected as an increase in capacitance noise. The rate of capacitance increase at the suprathreshold concentration(s) was determined as the slope of the line tangent to the Cm curve over the time interval corresponding to the designated cytosolic Ca range (see broken arrows to the left andupward). In the case of the asynchronous exocytosis, the Ca level chosen was the peak level at the end of the train. The average value obtained for the two runs shown was chosen as the Ca value for use with toxin-related release.

Similar articles

Cited by

References

    1. Artalejo CR, Henley JR, McNiven MA, Palfrey HC. Rapid endocytosis coupled to exocytosis in adrenal chromaffin cells involves Ca2+, GTP, and dynamin but not clathrin. Proc Natl Acad Sci USA. 1995;92:8328–8332. - PMC - PubMed
    1. Augustine GA, Neher E. Calcium requirements for secretion in bovine chromaffin cells. J Physiol (Lond) 1992;450:247–271. - PMC - PubMed
    1. Barnett DW, Misler S. An optimized approach to membrane capacitance estimation using dual frequency excitation. Biophys J. 1997;72:1641–1658. - PMC - PubMed
    1. Barnett DW, Liu J, Misler S. Single-cell measurements of quantal secretion induced by rat adrenal chromaffin cells: dependence on extracellular Ca2+. Pflügers Arch. 1996;432:1039–1046. - PubMed
    1. Barnett DW, Liu J, Misler S. Depolarization-induced asynchronous release from rat adrenal chromaffin cells. Biophys J. 1997;72:A157.

Publication types

LinkOut - more resources