. 1998 Aug 15;18(16):6147-62.
doi: 10.1523/JNEUROSCI.18-16-06147.1998.

Calcium dependence and recovery kinetics of presynaptic depression at the climbing fiber to Purkinje cell synapse

Affiliations

Calcium dependence and recovery kinetics of presynaptic depression at the climbing fiber to Purkinje cell synapse

J S Dittman et al. J Neurosci. .

Abstract

Short-term depression is a widespread form of use-dependent plasticity found in the peripheral and central nervous systems of invertebrates and vertebrates. The mechanism behind this transient decrease in synaptic strength is thought to be primarily the result of presynaptic "depletion" of a readily releasable neurotransmitter pool, which typically recovers with a time constant of a few seconds. We studied the mechanism and dynamics of recovery from depression at the climbing fiber to Purkinje cell synapse, where marked presynaptic depression has been described previously. Climbing fibers are well suited to studies of recovery from depression because they display little, if any, facilitation (even under conditions of low-release probability), which can obscure rapid recovery from depression for hundreds of milliseconds after release. We found that recovery from depression occurred in three kinetic phases. The fast and intermediate components could be approximated by exponentials with time constants of 100 msec and 3 sec at 24 degrees C. A much slower recovery phase was also present, but it was only prominent during prolonged stimulus trains. The fast component was enhanced by raising extracellular calcium and was eliminated by lowering presynaptic calcium, suggesting that, on short time scales, recovery from depression is driven by residual calcium. During regular and Poisson stimulus trains, recovery from depression was dramatically accelerated by accumulation of presynaptic residual calcium, maintaining synaptic efficacy under conditions that would otherwise deplete the available transmitter pool. This represents a novel form of presynaptic plasticity in that high levels of activity modulate the rate of recovery as well as the magnitude of depression.


Figures
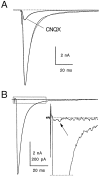
Fig. 1.
Fig. 1.
Stimulation of climbing fiber synaptic currents.A, Evoked climbing fiber EPSC before (thin line) and during (thick line) bath application of 3 μm CNQX. The synaptic response in CNQX was scaled to the control response (dotted line) for comparison of the EPSC waveform. Traces are averages of 10 trials each.B, Consecutive traces taken during perithreshold stimulation of a climbing fiber demonstrating the all-or-none behavior of CF-EPSCs. The inset is taken from the boxed region indicated. Thearrow indicates the climbing fiber failure.
Fig. 2.
Fig. 2.
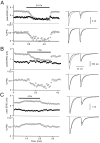
Dependence of release probability and PPD on external Ca. A, Top left, Peak EPSC time course for a pair of EPSCs recorded with a 30 msec interstimulus interval in 2 Cae. EPSC1 is indicated byopen circles, and EPSC2 is indicated byfilled circles. Low Ca external solution (0.5 mm Ca; 2.5 mm Mg) was applied during the time indicated by the thick horizontal line. Bottom left, Paired-pulse depression plotted for each data point.Top right, Average of 10 traces taken before (thin lines) and during (thick lines) exposure to low Cae. Bottom right, Traces replotted normalized to the peak of the first EPSC. B, Application of 1 Cae.C, Application of 4 Cae.
Fig. 3.
Fig. 3.
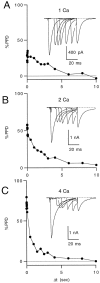
Kinetics of recovery from paired-pulse depression. Representative experiments showing recovery from depression in 1 Cae (A), 2 Cae(B), and 4 Cae(C). Insets are singletraces for paired-pulse intervals of 10, 15, 20, 30, 40, and 50 msec after control stimulation. %PPD = 100 (EPSC1 − EPSC2)/EPSC1, where EPSC1 and EPSC2 are, respectively, the amplitudes of the control and depressed EPSCs.
Fig. 4.
Fig. 4.
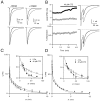
Dependence of recovery kinetics on external calcium. A, Average recovery of depression in 1 Cae (top; n = 9), 2 Cae (middle; n = 11), and 4 Cae (bottom; n = 12). Error bars indicate SEM. In 1 Cae, data were fit to %PPD = Ae−t/τ, withA = 36%, and τ = 3.6 sec. In 2 and 4 Cae, data were fit to %PPD =Afaste−t/τfast+Aintere−t/τinter. In 2 Cae, Afast = 21%,Ainter = 40%, τfast = 99 msec, and τinter = 3.2 sec. In 4 Cae,Afast = 44%,Ainter = 38%, τfast = 87 msec, and τinter = 2.5 sec. B, Superimposed PPD curves for the three external calcium conditions.Inset, Early time points for the rapid phase of recovery from depression in 1 Cae (filled circles), 2 Cae (open circles), and 4 Cae (filled diamonds).
Fig. 5.
Fig. 5.
Effects of cyclothiazide on the rapid phase of recovery from depression. A, Top, Synaptic currents recorded in the absence (left) and presence (right) of 1 μm CNQX before (thick line) and during (thin line) exposure to 40 μm CTZ. CTZ slowed the decay times from 4 to 9 msec (left) and from 6 to 11 msec (right). Bottom, Tracesnormalized for comparison. The effect of CTZ on the amplitude of the EPSC is discussed in Materials and Methods. Traces are averages of 10 trials. B, Left, Effect of 40 μm CTZ on the amplitude of EPSC1(filled circles), EPSC2 (open circles), and %PPD (bottom; Δt = 15 msec). Right, Averages of 10 traces in control (thin lines) and 40 μm CTZ (thick lines). Lower trace, Same traces scaled to the peak of the first EPSC.C, Average time course of PPD in control conditions (open circles) and in 2 Cae and 40 μm CTZ (filled circles; four experiments). The CTZ recovery curve was fit to a double exponential with Afast = 38%,Ainter = 39%, τfast = 25 msec, and τinter = 2.4 sec. D, Average time course of PPD in 4 Cae without (open circles) and with 40 μm CTZ (filled circles; four experiments). The CTZ recovery curve was fit to a double exponential decay with amplitudesAfast = 50%,Ainter = 52%, τfast = 23 msec, and τinter = 1.7 sec.
Fig. 6.
Fig. 6.
The effect of intracellular EGTA on the rapid recovery phase of depression. A, PPD recovery kinetics in 4 Cae before (filled circles) and after (open circles) exposure to 100 μmEGTA-AM. Insets, Synaptic currents for brief interpulse intervals before (top) and after (bottom) loading with EGTA-AM. B, Left, Effects of 100 μm EGTA-AM on the control EPSC (filled circles), the depressed EPSC (open circles), and %PPD (bottom). Top right, Averages of 10traces before (thin lines) and after (thick lines) exposure to EGTA-AM. Interpulse interval was 500 msec. Bottom right, Same tracesscaled to peak of first EPSC. C, Average time course of PPD in 4 Cae before (closed circles) and after (open circles; 12 experiments; mean ± SEM) loading with EGTA-AM. Inset, Early interpulse intervals. The PPD recovery curve after loading with EGTA-AM was fit to a double exponential decay with amplitudes Afast = 17%, Ainter = 65%, τfast = 17 msec, and τinter = 2.9 sec. D, Semilog plot of the data in C.
Fig. 7.
Fig. 7.
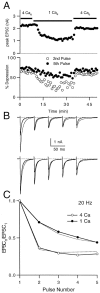
Dynamics of presynaptic depression during stimulus trains. A, Top, Peak EPSC for the first pulse in a train of five stimuli given at 20 Hz while changing from 4 to 1 Cae. Bottom, Depression of the second pulse relative to the first (open circles) and of the fifth pulse relative to the first (filled circles) during solution exchange. B,Top, EPSC trains in 4 Cae (thin lines) and 1 Cae (thick lines).Bottom, Same traces normalized to the first EPSC. Traces are averages of 5–10 trials each.C, Depression magnitude plotted versus stimulus pulse number for 4 Cae (open circles) and 1 Cae (closed circles). Dashed lines are predictions from the recovery model (see Results).
Fig. 8.
Fig. 8.
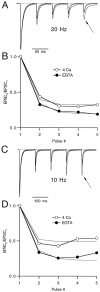
Effects of perturbing presynaptic calcium dynamics on depression during stimulus trains. A, EPSC train at 20 Hz in 4 Cae (thin lines) and with EGTA-AM (thick lines). Traces are averages of five trials and normalized to the peak of the first EPSC. Thearrow indicates depression in 4 Cae.B, Depression magnitude plotted versus stimulus pulse number for 20 Hz train in 4 Cae (open circles) and 4 Cae and EGTA (filled circles). Dashed lines are predictions from the recovery model (see Results). C, Same asA with a 10 Hz train. Note the scale bar change.D, Same as B with a 10 Hz train.
Fig. 9.
Fig. 9.
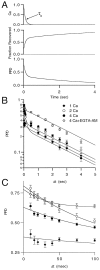
Model for calcium-dependent recovery from presynaptic depression. A, Simulation of presynaptic residual calcium (top), fraction of release sites available (middle), and fraction of depressed sites (bottom) after an action potential. B, Summary PPD data fit with the calcium-dependent recovery model; 1 Cae (filled diamonds), 2 Cae (open circles), 4 Cae(filled circles), and 4 Cae and EGTA (open diamonds). Inset, Same data on an expanded time scale. Data points are mean ± SEM. Model parameters for fits are ko = 0.314 sec-1; kmax = 8 sec-1; KN = 1.05; τc = 120 msec (20 msec in EGTA); andpo = 0.38, 0.63, 0.81, and 0.78 in 1 Cae, 2 Cae, 4 Cae, and EGTA, respectively. Ca influx increased by a factor of 2.5 going from 2 to 4 Cae and decreased by a factor of 3.3 going from 2 to 1 Cae. C, Same PPD data on an expanded time scale to compare rapid decay components.
Fig. 10.
Fig. 10.
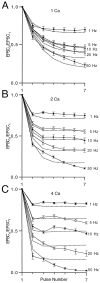
Experimental summary of depression during stimulus trains under various external calcium conditions.A, Relative depression in 1 Cae during trains of stimuli given at various frequencies for the second through seventh pulse in a train. Data are mean ± SEM; 1 Hz (filled circles; n = 6), 5 Hz (open circles; n = 6), 10 Hz (filled diamonds; n = 12), 20 Hz (open diamonds; n = 11), and 50 Hz (filled triangles; n = 7).B, Relative depression in 2 Cae.C, Relative depression in 4 Cae.
Fig. 11.
Fig. 11.
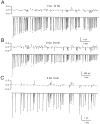
Examples of depression during Poisson train stimuli under various external calcium conditions. A, Climbing fiber stimulation in 1 Cae using a random spike train with average rate of 10 Hz. Open circlesare predictions of the recovery model (Scheme II, see Materials and Methods). Relative errors between the simulation and the data are shownabove. Model parameters wereko = 0.31 sec-1,kmax = 7.5 sec-1,KN = 0.9, τ = 100 msec,po = 0.16,kslow = 0.1, and α = 0.08. Calcium influx was reduced by 3.7-fold relative to 2 Cae.B, Same as A in 2 Cae. Model parameters were ko = 0.31 sec-1, kmax = 7.5 sec-1, KN = 0.8, τ = 100 msec, po = 0.5,kslow = 0.1, and α = 0.06.C, Same as A in 4 Cae. Model parameters were ko = 0.31 sec-1, kmax = 8.5 sec-1, KN = 0.75, τ = 115 msec, po = 0.65,kslow = 0.1, and α = 0.03. Calcium influx was increased by 60% relative to 2 Cae. All data are single trials.
Fig. 12.
Fig. 12.
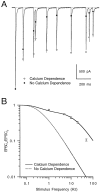
Behavior of presynaptic depression with and without calcium dependence. A, Brief Poisson stimulus train in 2 Cae. Closed circles are predictions of the calcium-independent recovery model (Scheme I), andopen circles are predictions of the calcium-dependent recovery model (Scheme II). B, Steady-state attenuation of synaptic strength during stimulus trains of various frequencies according to the calcium-dependent recovery model (solid line) and the calcium-independent recovery model (dotted line). Data points correspond to EPSC7/EPSC0 from Figure 10B. Model parameters were ko = 0.31 sec-1, kmax = 8.5 sec-1, KN = 1, τ = 100 msec, and po = 0.6. For prolonged stimulation, where scheme III is required, additional depression is expected.
None
None
None

References

    1. Abbott LF, Sen K, Varela JA, Nelson SB. Synaptic depression and cortical gain control. Science. 1997;275:220–222. - PubMed
    1. Adler EM, Augustine GJ, Duffy SN, Charlton MP. Alien intracellular calcium chelators attenuate neurotransmitter release at the squid giant synapse. J Neurosci. 1991;11:1496–1507. - PMC - PubMed
    1. Armstrong DM, Rawson JA. Activity patterns of cerebellar cortical neurones and climbing fibre afferents in the awake cat. J Physiol (Lond) 1979;289:425–448. - PMC - PubMed
    1. Artalejo CR, Henley JR, McNiven MA, Palfrey HC. Rapid endocytosis coupled to exocytosis in adrenal chromaffin cells involves Ca2+, GTP, and dynamin but not clathrin. Proc Natl Acad Sci USA. 1995;92:8328–8332. - PMC - PubMed
    1. Artalejo CR, Elhamdani A, Palfrey HC. Calmodulin is the divalent cation receptor for rapid endocytosis, but not exocytosis, in adrenal chromaffin cells. Neuron. 1996;16:195–205. - PubMed

Publication types

LinkOut - more resources