Transplanted olfactory ensheathing cells remyelinate and enhance axonal conduction in the demyelinated dorsal columns of the rat spinal cord
- PMID: 9698311
- PMCID: PMC2605360
- DOI: 10.1523/JNEUROSCI.18-16-06176.1998
Transplanted olfactory ensheathing cells remyelinate and enhance axonal conduction in the demyelinated dorsal columns of the rat spinal cord
Abstract
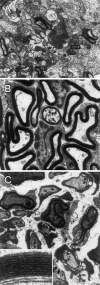
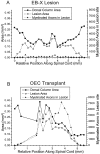
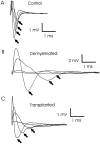
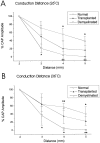
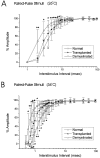
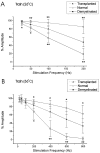
Olfactory ensheathing cells (OECs), which have properties of both astrocytes and Schwann cells, can remyelinate axons with a Schwann cell-like pattern of myelin. In this study the pattern and extent of remyelination and the electrophysiological properties of dorsal column axons were characterized after transplantation of OECs into a demyelinated rat spinal cord lesion. Dorsal columns of adult rat spinal cords were demyelinated by x-ray irradiation and focal injections of ethidium bromide. Cell suspensions of acutely dissociated OECs from neonatal rats were injected into the lesion 6 d after x-ray irradiation. At 21-25 d after transplantation of OECs, the spinal cords were maintained in an in vitro recording chamber to study the conduction properties of the axons. The remyelinated axons displayed improved conduction velocity and frequency-response properties, and action potentials were conducted a greater distance into the lesion, suggesting that conduction block was overcome. Quantitative histological analysis revealed remyelinated axons near and remote from the cell injection site, indicating extensive migration of OECs within the lesion. These data support the conclusion that transplantation of neonatal OECs results in quantitatively extensive and functional remyelination of demyelinated dorsal column axons.
Figures




Similar articles
-
[Remyelination by Schwann cell transplantation for CNS demyelinated axons: functional comparison with developmental myelination].No To Shinkei. 2000 Aug;52(8):701-7. No To Shinkei. 2000. PMID: 11002480 Japanese.
-
Restoration of normal conduction properties in demyelinated spinal cord axons in the adult rat by transplantation of exogenous Schwann cells.J Neurosci. 1996 May 15;16(10):3199-208. doi: 10.1523/JNEUROSCI.16-10-03199.1996. J Neurosci. 1996. PMID: 8627358 Free PMC article.
-
[Comparison of myelin-forming cells as candidates for therapeutic transplantation in demyelinated CNS axons].No To Shinkei. 2000 Jul;52(7):609-15. No To Shinkei. 2000. PMID: 10934721 Japanese.
-
Remyelination after olfactory ensheathing cell transplantation into diverse demyelinating environments.Exp Neurol. 2011 May;229(1):88-98. doi: 10.1016/j.expneurol.2011.01.010. Epub 2011 Jan 28. Exp Neurol. 2011. PMID: 21281634 Review.
-
Defining the role of olfactory ensheathing cells in facilitating axon remyelination following damage to the spinal cord.FASEB J. 2005 May;19(7):694-703. doi: 10.1096/fj.04-2833rev. FASEB J. 2005. PMID: 15857884 Review.
Cited by
-
Experimental and therapeutic opportunities for stem cells in multiple sclerosis.Int J Mol Sci. 2012 Nov 8;13(11):14470-91. doi: 10.3390/ijms131114470. Int J Mol Sci. 2012. PMID: 23203076 Free PMC article. Review.
-
CNPase expression in olfactory ensheathing cells.J Biomed Biotechnol. 2011;2011:608496. doi: 10.1155/2011/608496. Epub 2011 Nov 16. J Biomed Biotechnol. 2011. PMID: 22174557 Free PMC article.
-
Glial cells in the mammalian olfactory bulb.Front Cell Neurosci. 2024 Jul 16;18:1426094. doi: 10.3389/fncel.2024.1426094. eCollection 2024. Front Cell Neurosci. 2024. PMID: 39081666 Free PMC article. Review.
-
Generation of magnetized olfactory ensheathing cells for regenerative studies in the central and peripheral nervous tissue.Int J Mol Sci. 2013 May 24;14(6):10852-68. doi: 10.3390/ijms140610852. Int J Mol Sci. 2013. PMID: 23708092 Free PMC article.
-
Spinal cord injury I: A synopsis of the basic science.Can Vet J. 2010 May;51(5):485-92. Can Vet J. 2010. PMID: 20676289 Free PMC article. Review.
References
-
- Blakemore WF, Crang AJ. The use of cultured autologous Schwann cells to remyelinated areas of persistent demyelination in the central nervous system. J Neurol Sci. 1985;70:207–223. - PubMed
-
- Blakemore WF, Patterson RC. Suppression of remyelination in the CNS by X-irradiation. Acta Neuropathol (Berl) 1978;42:105–113. - PubMed
-
- Chuah MI, Au C. Cultures of ensheathing cells from neonatal rat olfactory bulbs. Brain Res. 1993;601:213–220. - PubMed
-
- Devon R, Doucette R. Olfactory ensheathing cells myelinate dorsal root ganglion neurites. Brain Res. 1992;589:175–179. - PubMed
-
- Doucette R. PNS–CNS transitional zone of the first cranial nerve. J Comp Neurol. 1991;312:451–466. - PubMed
Publication types
MeSH terms
Grants and funding
LinkOut - more resources
Full Text Sources
Other Literature Sources
