Growth-related and antennular amputation-induced changes in the olfactory centers of crayfish brain
- PMID: 9698313
- PMCID: PMC6793174
- DOI: 10.1523/JNEUROSCI.18-16-06195.1998
Growth-related and antennular amputation-induced changes in the olfactory centers of crayfish brain
Abstract
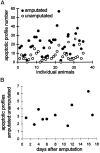
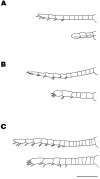
Freshwater crayfish increase in size throughout their lives, and this growth is accompanied by an increase in the length of the appendages and number of mechanoreceptive and chemoreceptive sensilla on them. We find that in the Australian freshwater crayfish Cherax destructor, neuropil volumes of the olfactory centers increase linearly with body size over the entire size range of animals found in their natural habitat. The number of cell somata of two groups of interneurons associated with the olfactory centers (projection neurons and small local neurons) also increases linearly with the size of the animals. In contrast, axon counts of interneurons that represent a nonolfactory input to the olfactory centers show that these reach a total number in the very early adult stages that then remains constant regardless of the size of the animal. Only the axon diameter of these interneurons increases linearly with body size. Amputation of the antennule and olfactory sensilla reduces the number of projection and local interneurons on the amputated side. No change in the size of the olfactory centers occurs on the unamputated side. Amputation of the olfactory receptor neurons in crayfish therefore leads not only to a degeneration of the receptor cell endings in the olfactory lobe but also to a trans-synaptic response in which the number of higher order neurons decreases. Reconstitution of the antennule and olfactory receptor neurons in small adult crayfish is accompanied by the reestablishment of the normal number of interneurons and neuropil volume in the olfactory centers.
Figures


Similar articles
-
Development, growth, and plasticity in the crayfish olfactory system.Microsc Res Tech. 2003 Feb 15;60(3):266-77. doi: 10.1002/jemt.10266. Microsc Res Tech. 2003. PMID: 12539157 Review.
-
Electrical responses and synaptic connections of giant serotonin-immunoreactive neurons in crayfish olfactory and accessory lobes.J Comp Neurol. 1994 Mar 1;341(1):130-44. doi: 10.1002/cne.903410111. J Comp Neurol. 1994. PMID: 8006219
-
Crayfish brain interneurons that converge with serotonin giant cells in accessory lobe glomeruli.J Comp Neurol. 1995 Feb 6;352(2):263-79. doi: 10.1002/cne.903520209. J Comp Neurol. 1995. PMID: 7721994
-
Neurogenesis in the central olfactory pathway of adult decapod crustaceans: development of the neurogenic niche in the brains of procambarid crayfish.Neural Dev. 2012 Jan 6;7:1. doi: 10.1186/1749-8104-7-1. Neural Dev. 2012. PMID: 22225949 Free PMC article.
-
[Systems of chemoperception in decapod crayfish].Zh Evol Biokhim Fiziol. 2009 Jan-Feb;45(1):3-24. Zh Evol Biokhim Fiziol. 2009. PMID: 19370985 Review. Russian.
Cited by
-
A Balancing Act: The Immune System Supports Neurodegeneration and Neurogenesis.Cell Mol Neurobiol. 2020 Aug;40(6):967-989. doi: 10.1007/s10571-020-00787-5. Epub 2020 Jan 24. Cell Mol Neurobiol. 2020. PMID: 31980992 Free PMC article.
-
Cytoarchitecture and ultrastructure of neural stem cell niches and neurogenic complexes maintaining adult neurogenesis in the olfactory midbrain of spiny lobsters, Panulirus argus.J Comp Neurol. 2011 Aug 15;519(12):2283-319. doi: 10.1002/cne.22657. J Comp Neurol. 2011. PMID: 21523781 Free PMC article.
-
Adult neurogenesis: examples from the decapod crustaceans and comparisons with mammals.Arthropod Struct Dev. 2011 May;40(3):258-75. doi: 10.1016/j.asd.2011.03.001. Epub 2011 Mar 9. Arthropod Struct Dev. 2011. PMID: 21396485 Free PMC article. Review.
-
Environmentally relevant atrazine exposures cause DNA damage in cells of the lateral antennules of crayfish (Faxonius virilis).Chemosphere. 2020 Jan;239:124786. doi: 10.1016/j.chemosphere.2019.124786. Epub 2019 Sep 5. Chemosphere. 2020. PMID: 31520975 Free PMC article.
-
From embryo to adult: persistent neurogenesis and apoptotic cell death shape the lobster deutocerebrum.J Neurosci. 1999 May 1;19(9):3472-85. doi: 10.1523/JNEUROSCI.19-09-03472.1999. J Neurosci. 1999. PMID: 10212307 Free PMC article.
References
-
- Altman JS. Toluidine blue as a rapid stain for nerve cell bodies in intact ganglia. In: Strausfeld NJ, Miller TA, editors. Neuroanatomical techniques: insect nervous system. Springer; New York: 1980. pp. 21–23.
-
- Atwood HL, Wojtowicz JM. Short-term and long-term plasticity and physiological differentiation of crustacean motor synapses. Int Rev Neurobiol. 1986;28:275–362. - PubMed
-
- Bieber M, Fuldner D. Brain growth during the adult stage of a holometabolous insect. Naturwissenschaften. 1979;66:426.
-
- Blest AD, Davie PS. Reduced silver impregnations derived from the Holmes technique. In: Strausfeld NJ, Miller TA, editors. Neuroanatomical techniques: insect nervous system. Springer; New York: 1980. pp. 98–117.
-
- Brunjes P. Unilateral naris closure and olfactory system development. Brain Res Rev. 1994;19:146–160. - PubMed
Publication types
MeSH terms
LinkOut - more resources
Full Text Sources
