. 1998 Aug 15;18(16):6279-89.
doi: 10.1523/JNEUROSCI.18-16-06279.1998.

Brain endothelial cells express cyclooxygenase-2 during lipopolysaccharide-induced fever: light and electron microscopic immunocytochemical studies

Affiliations

Brain endothelial cells express cyclooxygenase-2 during lipopolysaccharide-induced fever: light and electron microscopic immunocytochemical studies

K Matsumura et al. J Neurosci. .

Abstract

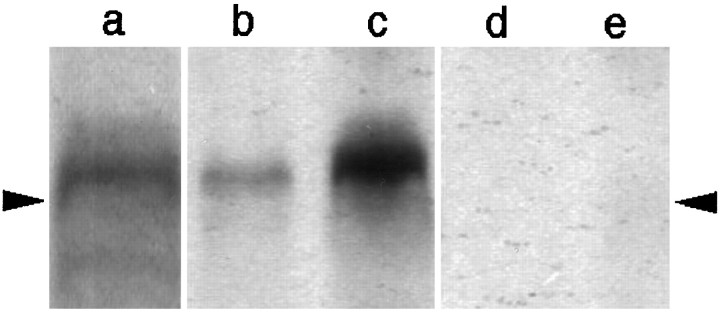
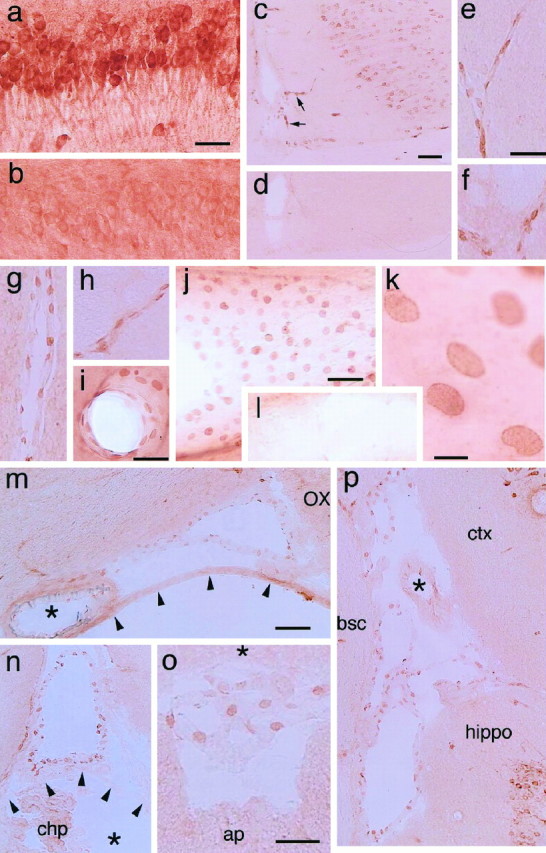
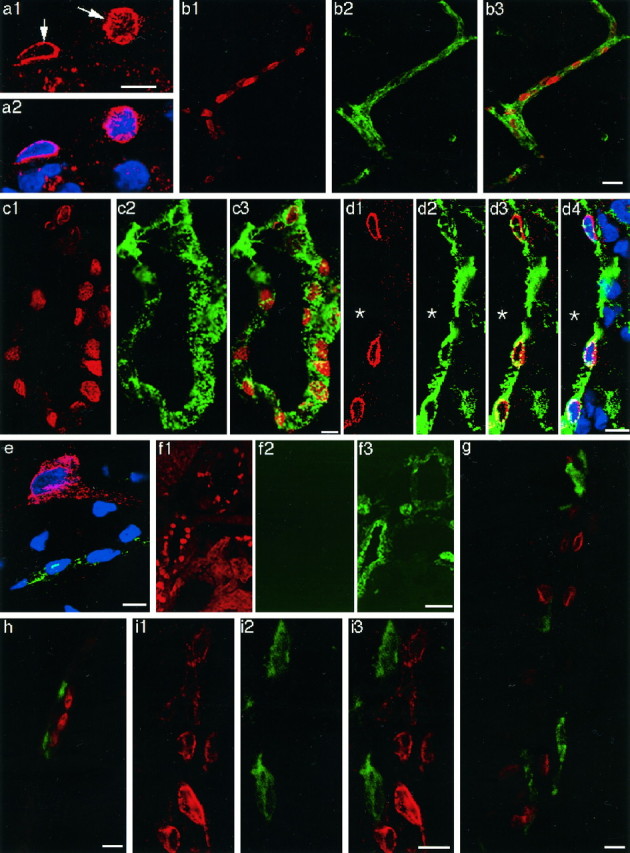
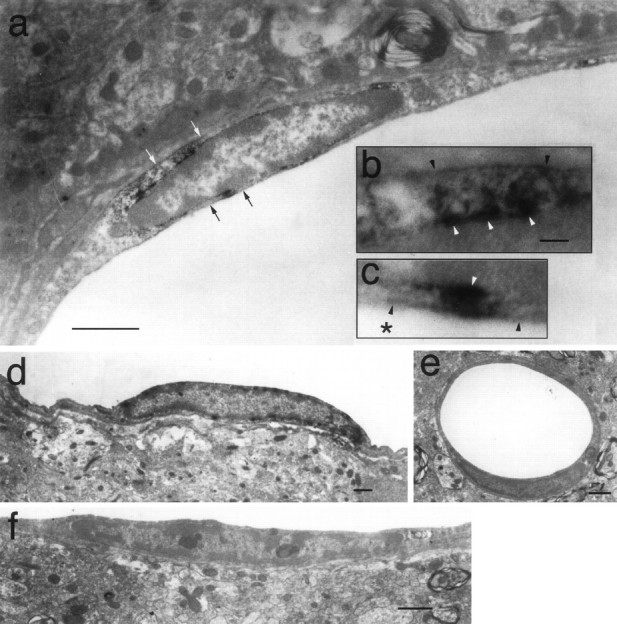
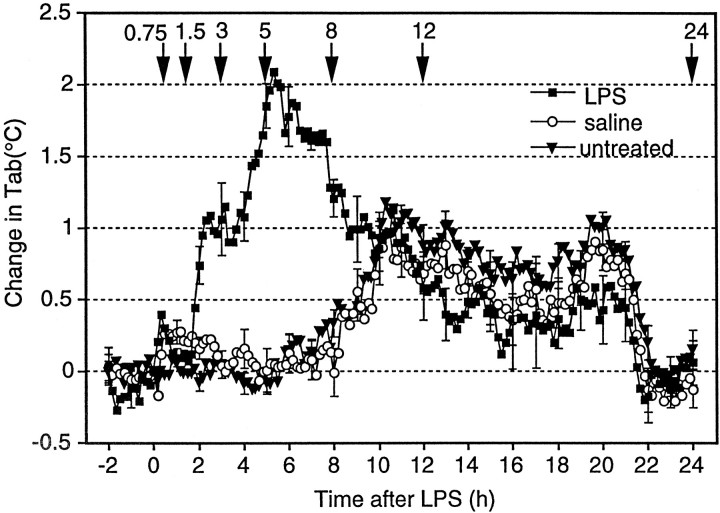
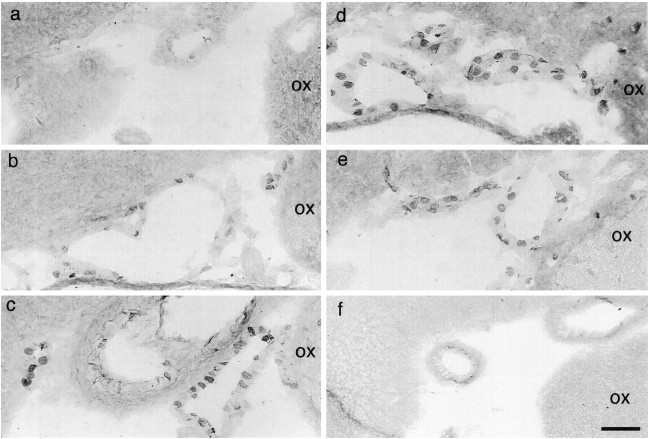
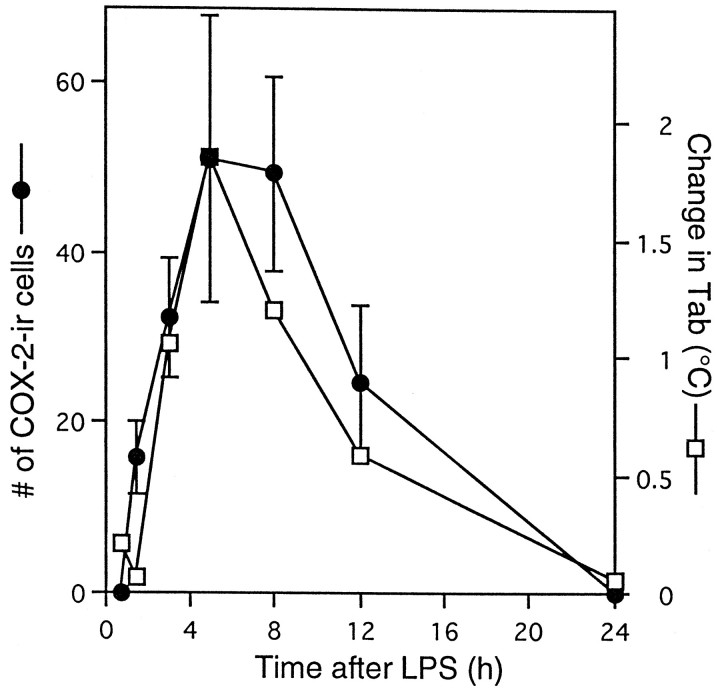
Cyclooxygenase-2 (COX-2), a key enzyme in the biosynthesis of prostaglandins, is induced in brain blood vessels by pyrogens, and its essential role in fever has been hypothesized. In this study, we determined (1) the type of cells that express cyclooxygenase-2 in brain blood vessels of lipopolysaccharide-treated rats, and (2) the precise relationship between the time course of fever and that of cyclooxygenase-2 protein expression in these cells. Five hours after the lipopolysaccharide injection (100 microg/kg, i.p.), cyclooxygenase-2-like immunoreactive cells were found in the parenchymal and subarachnoidal blood vessels. In these blood vessels, the cyclooxygenase-2-like immunoreactivity was restricted to the perinuclear region of the endothelial cells as revealed by a laser confocal microscopy, double-immunofluorescence staining with an endothelial marker, and immunoelectron microscopy. On the other hand, the cyclooxygenase-2-like immunoreactive cells were distinct from microglia or perivascular/meningeal macrophages as revealed by double immunostaining with macrophage/microglia-specific antibodies. Cyclooxygenase-2-like immunoreactive cells were first found at 1.5 hr after the lipopolysaccharide injection, at which time the fever had not been developed. After that, the number of cyclooxygenase-2-like immunoreactive cells and fever followed a similar time course, both being highest at 5 hr after the lipopolysaccharide injection and both returning to the baseline by 24 hr. These results demonstrate that brain endothelial cells are the primary sites where the activation of arachidonic acid cascade takes place during fever after intraperitoneal injection of lipopolysaccharide.


Figures

Fig. 1.
Fig. 1.
Western blot analysis of COX-2 in the blood vessel-enriched brain samples from rats that had been left untreated (b, d) or injected with LPS (100 μg/kg, i.p.) 5 hr before being killed (a, c, e). Both the monoclonal antibody (a) and polyclonal antibody (b, c) recognized a protein band, the molecular weight of which corresponded well to that of COX-2. The COX-2 signal was enhanced in the sample from an LPS-treated rat (c) compared with that from the untreated rat (b). Preabsorbed polyclonal antibody did not stain the protein band corresponding to COX-2 (d, e). The position of arrowheads indicates a molecular size of 68 kDa.
Fig. 2.
Fig. 2.
COX-2-ir cells in the brains of rats injected with either saline (a, b, l) or LPS (100 μg/kg, i.p.) (c–k, m–p) 5 hr before being killed.a, COX-2-ir neurons in the pyramidal cell layer of the hippocampus stained with the monoclonal antibody; b, the same area as in a stained with the preabsorbed monoclonal antibody; c, COX-2-ir cells in the cingulate cortex and in the blood vessels penetrating into the brain (arrows); d, the same area as inb stained with the preabsorbed polyclonal antibody;e–h, parenchymal blood vessels stained with the polyclonal antibody; i, j, COX-2-ir cells in the blood vessels stained with the monoclonal antibody; k, a higher magnified view of the same blood vessel as in j;l, no COX-2-ir cells are found in a blood vessel of a saline-treated rat; m, COX-2-ir cells in the subarachnoidal space lateral to the optic chiasma. Thearrowheads and asterisk indicate the arachnoid membrane and the basilar artery, respectively.OX, Optic chiasma; n, COX-2-ir cells in the subarachnoidal space dorsal to the third ventricle. The subarachnoidal space is separated from the third ventricle (*) by the velum interpositum (arrowheads). chp, Choroid plexus; o, COX-2-ir cells in the subarachnoidal space between the cerebellum (*) and dorsal medulla; ap, area postrema; p, COX-2-ir cells in the subarachnoidal space formed by the cortex (ctx), the hippocampus (hippo), and the dorsolateral brain stem, which is a transitional area between the superior colliculus and thalamus;bsc, brachium of the superior colliculus. Note that the blood vessel with a thick wall (denoted by *) contained fewer COX-2-ir cells than those with a thin wall (veins). Scale bars: a, b, e–i, o, 50 μm; c, d, j, l, m, n, p, 100 μm;k, 10 μm.
Fig. 3.
Fig. 3.
Laser confocal immunofluorescent views of COX-2-positive cells in the brains of LPS-treated rats.a1, COX-2-ir structure (arrows) in the cells of a blood vessel; a2, the COX-2 staining ina1 was overlaid with TOTO-3 nuclear staining (blue). Note that the COX-2-like immunoreactivity was restricted to the surface of the nucleus. COX-2-ir cells in parenchymal (b1) and subarachnoidal (c1, d1) blood vessels. The same blood vessels in b1, c1, andd1 were stained with anti-von Willebrand factor (b2, c2, and d2, respectively). The COX-2 immunostaining (red) was overlaid with von Willebrand factor immunostaining (green) (b3, c3, and d3). d4, The double immunostaining in d3 overlaid with TOTO-3 nuclear staining (blue); e, triple staining of COX-2 (red), von Willebrand factor (green), and nucleus (blue). Note that a neuron was positive for COX-2 but negative for von Willebrand factor; a capillary was positive for von Willebrand factor. COX-2-like immunoreactivity in the neuron was diffusely distributed in the soma and a process. f, A brain section was first stained for COX-2 (f1) and then incubated with FITC-labeled goat anti-rabbit IgG without a previous incubation with anti-von Willebrand factor (f2). Note that fluorescent signal of FITC was very low compared with that in the adjacent section, which had been first stained for COX-2 and then stained for anti-von Willebrand factor as described in Materials and Methods (f3), indicating that cross-binding of FITC-labeled goat anti-rabbit IgG to anti-COX-2 was negligible. Double immunostaining of COX-2-ir cells (red) and ED2-positive macrophages (green) in parenchymal (g) and subarachnoidal (h) blood vessels. COX-2-ir cells (i1) and OX-42-positive cells (i2) were located close to each other but were distinct from one another (i3). Scale bars: 10 μm;b, 20 μm; f, 50 μm.
Fig. 4.
Fig. 4.
Immunoelectron microscopic observation of COX-2-like immunoreactivity in endothelial cells of LPS-treated rats. COX-2-ir signals were located in the nuclear envelope and the cytosol nearby (a, d). b, c, Magnified views of the regions indicated in a with the white arrows and black arrows, respectively. Theblack and the white arrowheads inb and c indicate plasma membrane and nuclear membrane, respectively. The asterisk inc indicates the luminal side. Minimal COX-2-ir signal was found in capillaries (e). No COX-2-ir signal was observed in the samples incubated without the primary antibody (f). Scale bars: a, d–f, 1 μm; b, c, 0.1 μm.
Fig. 5.
Fig. 5.
Changes in abdominal temperature (Tab) of LPS-injected rats (squares), saline-injected rats (circles), and untreated rats (triangles). Tab of five rats was measured with a telemetry system without any treatment on the first day. On the second and fourth days, they were injected with saline (0.5 ml, i.p.) and LPS (100 μg/kg, 0.5 ml, i.p.), respectively. All of the injections were made between 9:30 and 10:00 A.M., and the values are expressed as the difference from the preinjection level. The time of injection was set to 0 on the x-axis. For the untreated group, the Tab at 10:00 A.M. was used as the baseline. The downward arrows and the numbers above indicate the time the rats were killed, which was conducted in a separate group of rats (see Fig. 6).
Fig. 6.
Fig. 6.
Time-dependent changes in the COX-2-ir cells in the subarachnoidal space lateral to the optic chiasma and ventral to the anteroventral preoptic area. After LPS injection, rats were killed at 45 min (a), 1.5 hr (b), 3 hr (c), 5 hr (d), 12 hr (e), and 24 hr (f).
Fig. 7.
Fig. 7.
Time courses of the number of COX-2-ir cells (•) and change in Tab (■). The data on the numbers of COX-2-ir cells were counted in the same subarachnoidal space as shown in Figure 6.

References

    1. Blalock JE. A molecular basis for bidirectional communication between the immune and neuroendocrine systems. Physiol Rev. 1989;69:1–32. - PubMed
    1. Blatteis CM, Sehic E. Fever: how may circulating pyrogens signal the brain? News Physiol Sci. 1997;12:1–9.
    1. Breder CD, Saper CB. Expression of inducible cyclooxygenase mRNA in the mouse brain after systemic administration of bacterial lipopolysaccharide. Brain Res. 1996;713:64–69. - PubMed
    1. Breder CD, Dewitt D, Kraig RP. Characterization of inducible cyclooxygenase in rat brain. J Comp Neurol. 1995;355:296–315. - PMC - PubMed
    1. Cao C, Matsumura K, Yamagata K, Watanabe Y. Induction by lipopolysaccharide of cyclooxygenase-2 mRNA in rat brain; its possible role in the febrile response. Brain Res. 1995;697:187–196. - PubMed