

The functional anatomy of sound intensity discrimination
- PMID: 9698330
- PMCID: PMC6793181
- DOI: 10.1523/JNEUROSCI.18-16-06388.1998
The functional anatomy of sound intensity discrimination
Abstract
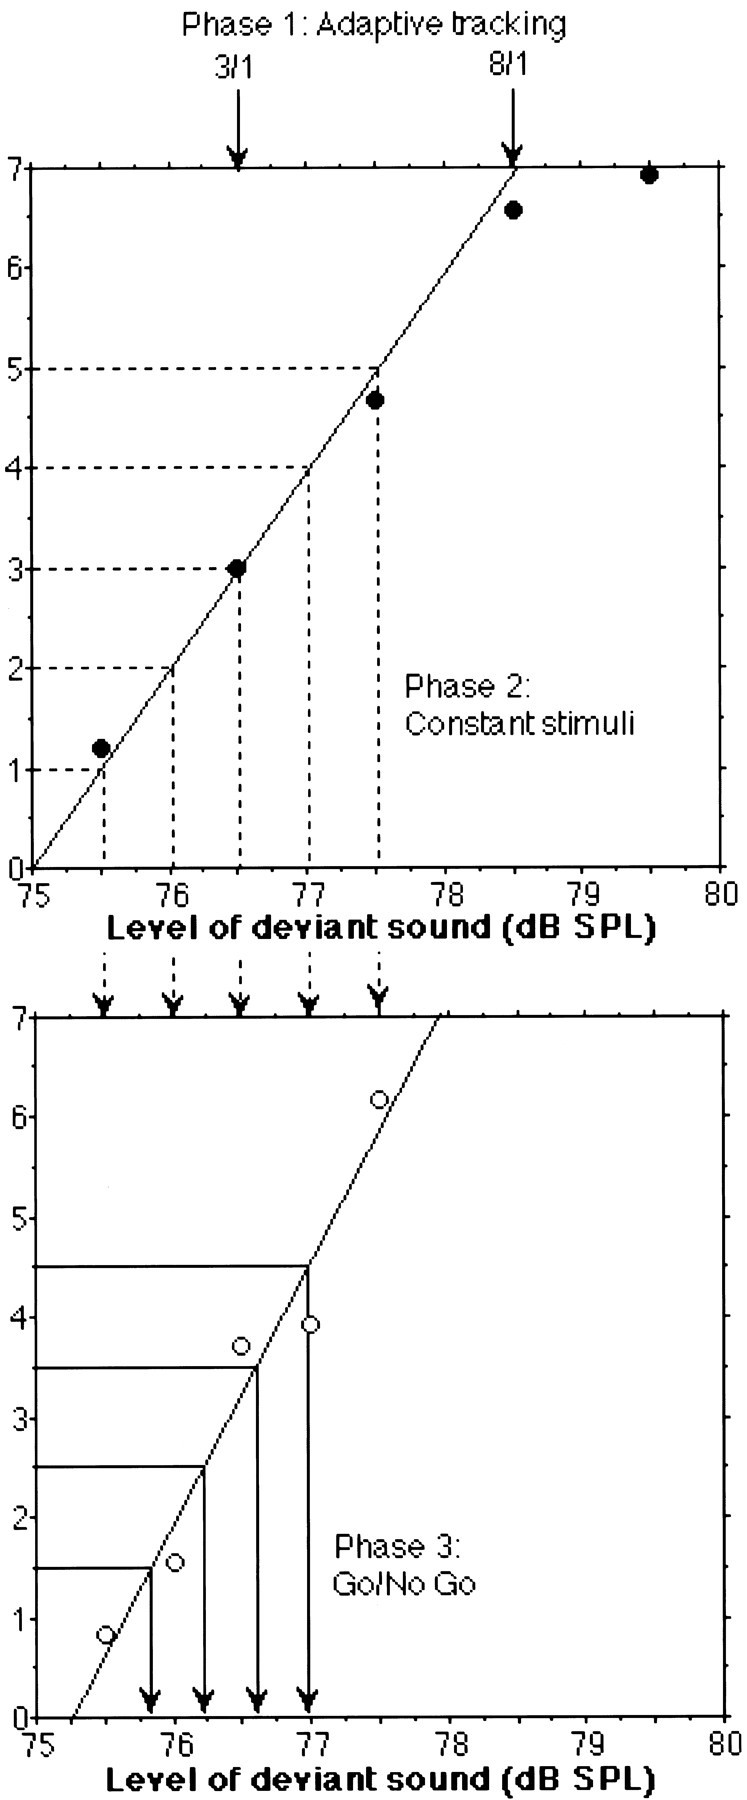
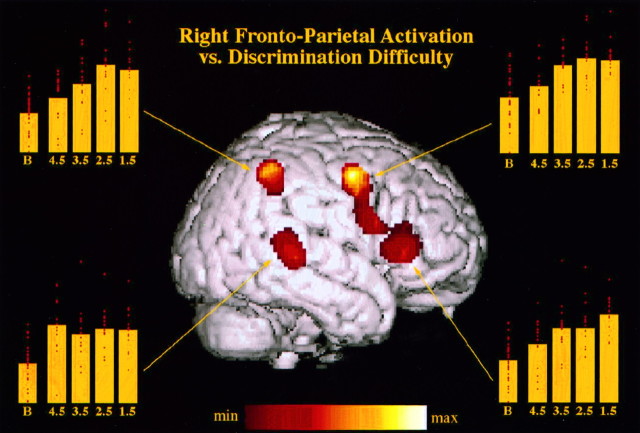
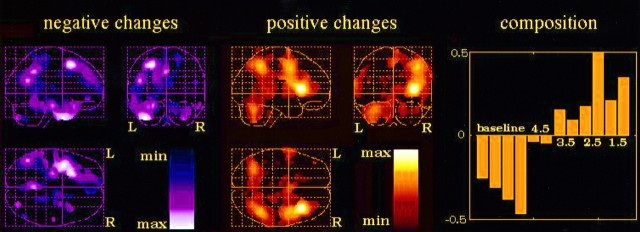
The human neuroanatomical substrate of sound intensity discrimination was investigated by combining psychoacoustics and functional neuroimaging. Seven normal subjects were trained to detect deviant sounds presented with a slightly higher intensity than a standard harmonic sound, using a Go/No Go paradigm. Individual psychometric curves were carefully assessed using a three-step psychoacoustic procedure. Subjects were scanned while passively listening to the standard sound and while discriminating changes in sound intensity at four different performance levels (d' = 1.5, 2.5, 3.5, and 4.5). Analysis of regional cerebral blood flow data outlined activation, during the discrimination conditions, of a right hemispheric frontoparietal network already reported in other studies of selective or sustained attention to sensory input, and in which activity appeared inversely proportional to intensity discriminability. Conversely, a right posterior temporal region included in secondary auditory cortex was activated during discrimination of sound intensity independently of performance level. These findings suggest that discrimination of sound intensity involves two different cortical networks: a supramodal right frontoparietal network responsible for allocation of sensory attentional resources, and a region of secondary auditory cortex specifically involved in sensory computation of sound intensity differences.
Figures
References
-
- Belin P, Zilbovicius M, Crozier S, Thivard L, Fontaine A, Masure M-C, Samson Y. Lateralization of speech and auditory temporal processing. J Cognit Neurosci. 1998;10:536–540. - PubMed
-
- Bendriem B, Casey M, Dahlbom M, Trebossen R, Blohm K, Nutt R, Syrota A. Evaluation of the ECAT EXACT HR+: a new positron camera with 2D/3D acquisition capabilities and nearly isotropic spatial resolution. J Nucl Med. 1996;37:170.
-
- Binder JR, Rao SM, Hammeke TA, Yetkin FZ, Jesmanowicz A, Bandettini PA, Wong EC, Estkowski LD, Goldstein MD, Haughton VM, Hyde JS. Functional magnetic resonance imaging of human auditory cortex. Ann Neurol. 1994;35:662–672. - PubMed
-
- Brugge JF, Reale RA. Auditory cortex. In: Peters A, Jones EG, editors. Cerebral cortex, Vol 4. Plenum; New York: 1985. pp. 229–271.
-
- Démonet JF, Chollet R, Ramsay S, Cardebat D, Nespoulos J, Wise R, Rascol A, Frackowiak RSJ. The anatomy of phonological and semantic processing in normal subjects. Brain. 1992;115:1753–1768. - PubMed
Publication types
MeSH terms
LinkOut - more resources
Full Text Sources