. 1998 Aug 15;18(16):6395-410.
doi: 10.1523/JNEUROSCI.18-16-06395.1998.

Synchronization of visual responses between the cortex, lateral geniculate nucleus, and retina in the anesthetized cat

Affiliations

Synchronization of visual responses between the cortex, lateral geniculate nucleus, and retina in the anesthetized cat

M Castelo-Branco et al. J Neurosci. .

Abstract

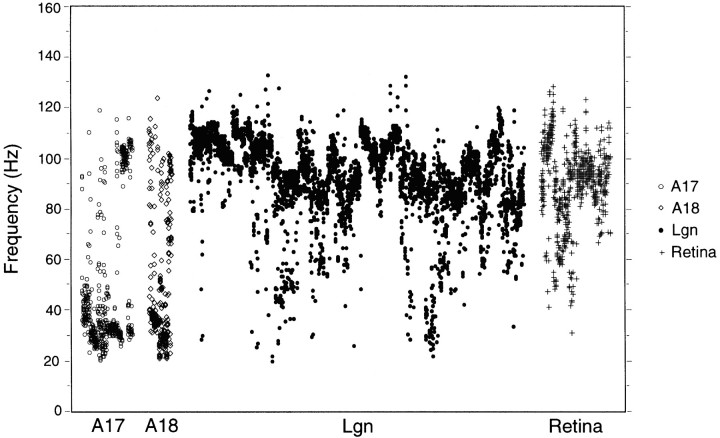
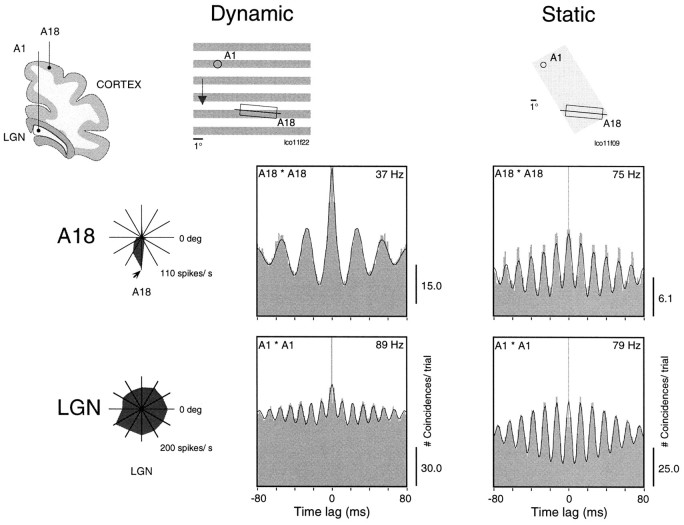
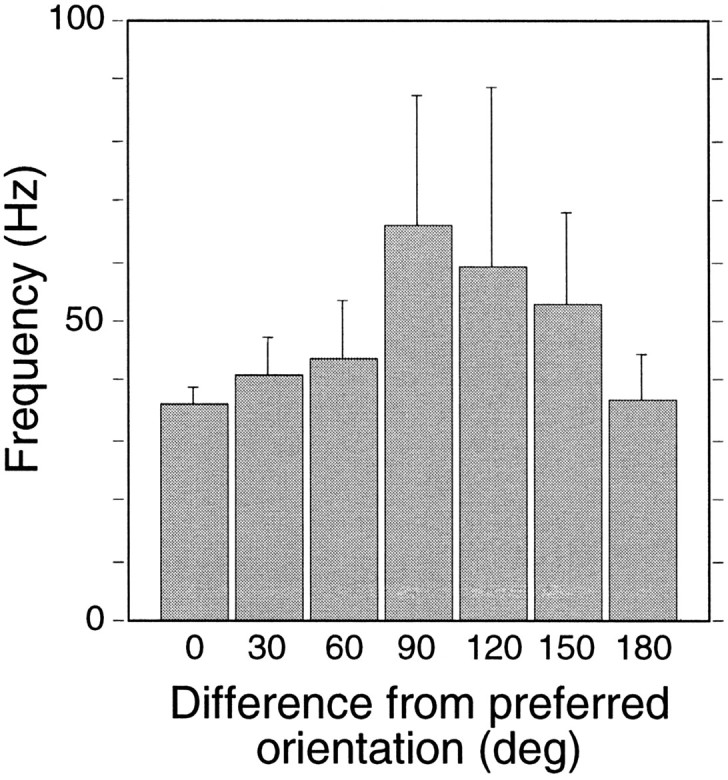
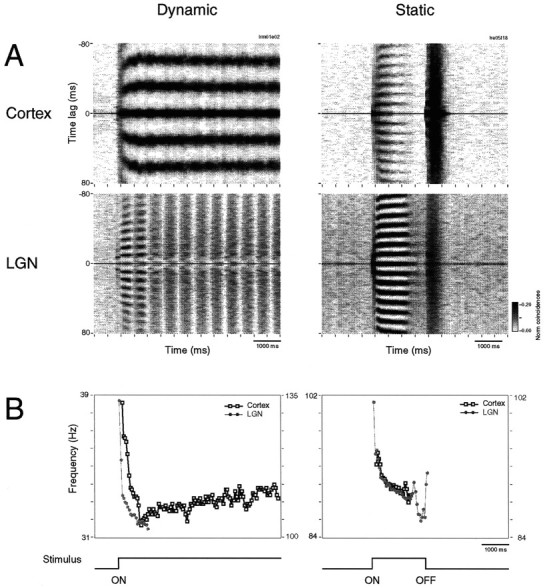
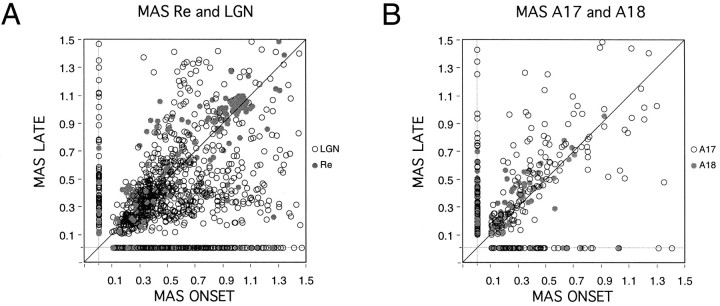
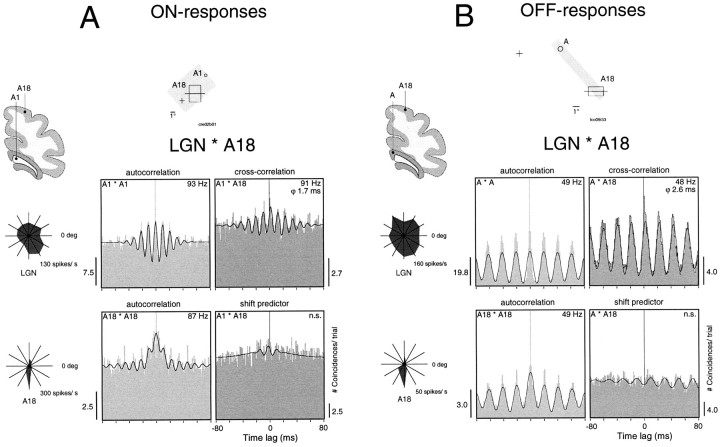
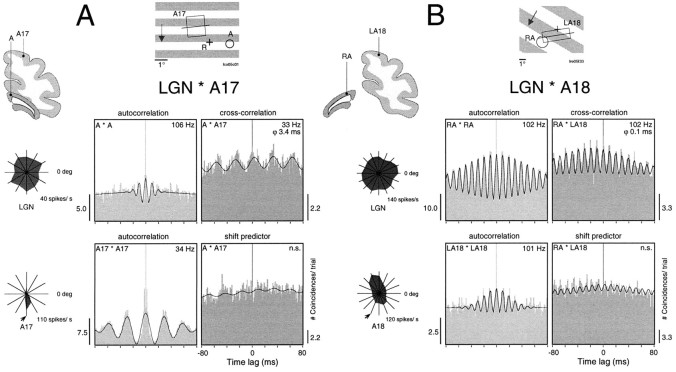
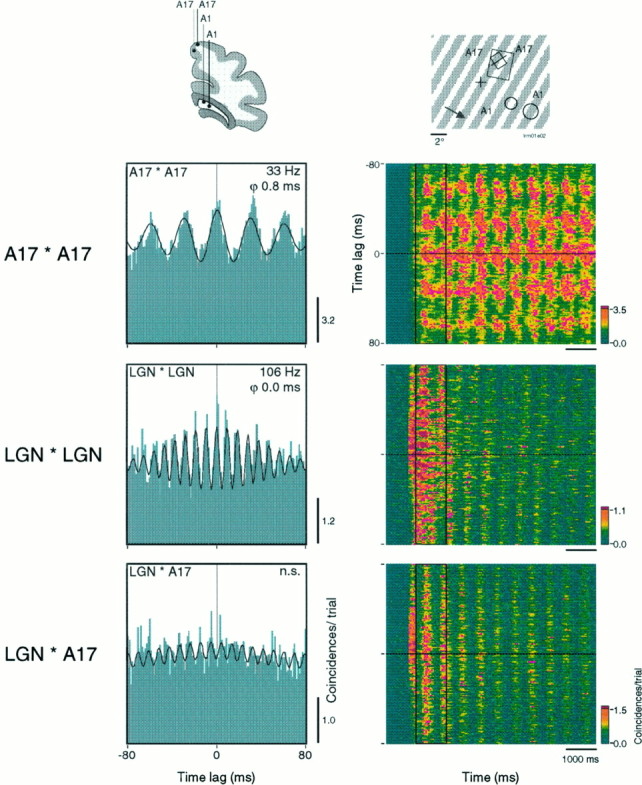
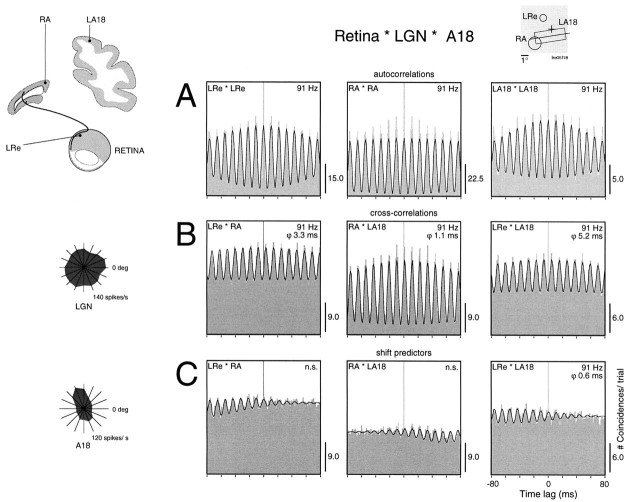
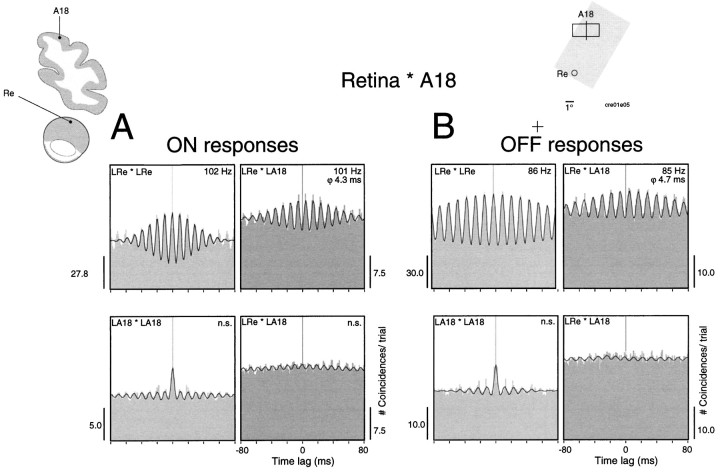
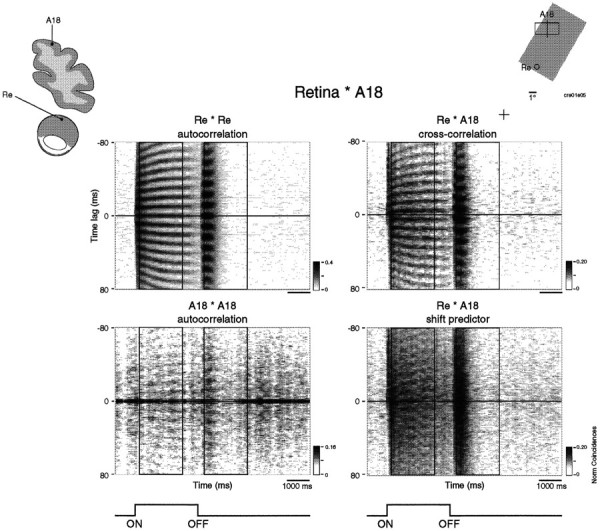
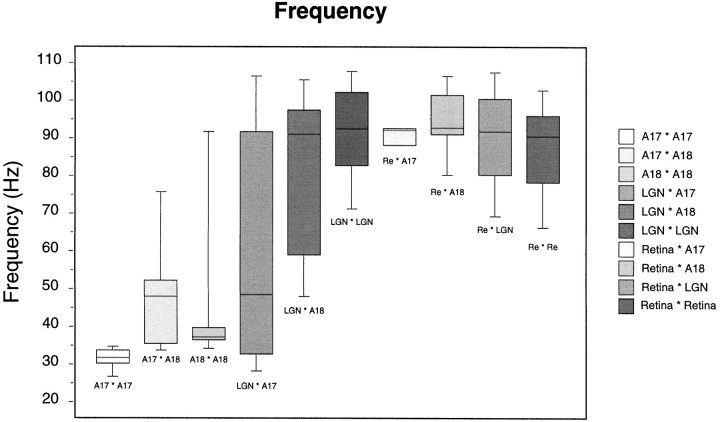
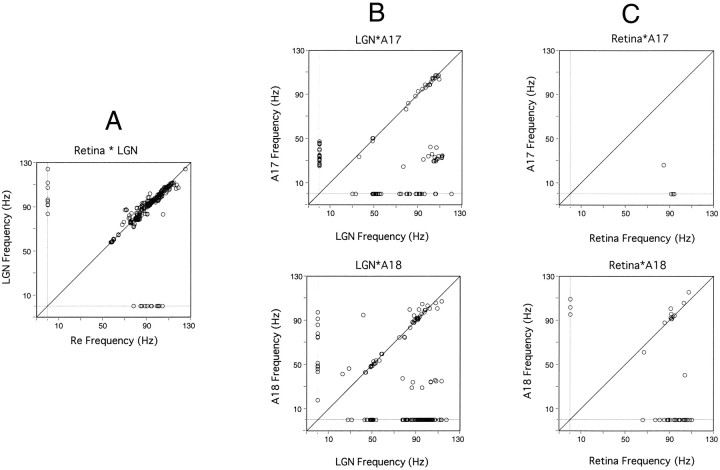
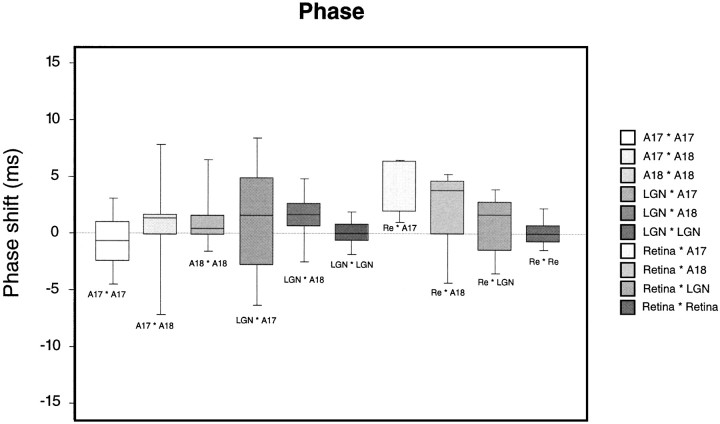
Synchronization of spatially distributed responses in the cortex is often associated with periodic activity. Recently, synchronous oscillatory patterning was described for visual responses in retinal ganglion cells that is reliably transmitted by the lateral geniculate nucleus (LGN), raising the question of whether oscillatory inputs contribute to synchronous oscillatory responses in the cortex. We have made simultaneous multi-unit recordings from visual areas 17 and 18 as well as the LGN and the retina to examine the interactions between subcortical and cortical synchronization mechanisms. Strong correlations of oscillatory responses were observed between retina, LGN, and cortex, indicating that cortical neurons can become synchronized by oscillatory activity relayed through the LGN. This feedforward synchronization occurred with oscillation frequencies in the range of 60-120 Hz and was most pronounced for responses to stationary flashed stimuli and more frequent for cells in area 18 than in area 17. In response to moving stimuli, by contrast, subcortical and cortical oscillations dissociated, proving the existence of independent subcortical and cortical mechanisms. Subcortical oscillations maintained their high frequencies but became transient. Cortical oscillations were now dominated by a cortical synchronizing mechanism operating in the 30-60 Hz frequency range. When the cortical mechanism dominated, LGN responses could become phase-locked to the cortical oscillations via corticothalamic feedback. In summary, synchronization of cortical responses can result from two independent but interacting mechanisms. First, a transient feedforward synchronization to high-frequency retinal oscillations, and second, an intracortical mechanism, which operates in a lower frequency range and induces more sustained synchronization.


Figures

Fig. 1.
Fig. 1.
Distribution of oscillation frequencies for all autocorrelation functions exhibiting a significant modulation. A17 (614 autocorrelation functions from 124 RSs), A18 (377 from 56 RSs), LGN (4084 from 485 RSs), and retina (841 from 120 RSs). Notice that oscillation frequencies cover a large range for all structures. Cortical oscillations tend to have a bimodal distribution, with two distinct clusters at 20–60 and 80–120 Hz, whereas thalamic and retinal oscillatory responses cover mostly the high-frequency range: from 60 to 120 Hz.
Fig. 2.
Fig. 2.
Comparison of oscillation frequencies for static and dynamic stimuli. Simultaneous multi-unit recordings were obtained from A18 and ipsilateral lamina A1, as represented in the top left inset. Left panels show autocorrelation functions obtained for responses to drifting gratings whose orientation and drift velocity matched the tuning of the cortical neurons (Dynamic). Right panels show autocorrelations for responses to a stationary, rectangular light stimulus flashed over the receptive fields (Static). Oscillation frequency indicated in each panel was derived from a generalized Gabor function fitted to the correlogram. Orientation tuning curves for A18 and LGN cells are shown to theleft; the arrow indicates the direction of motion. Notice that oscillation frequency for the cortical cells is much lower in response to the dynamic (37 Hz) than to the static stimulus (75 Hz). For the LGN cells, oscillatory modulations have similar high frequencies, regardless of stimulus condition. A schematic representation of the receptive fields (circles andrectangles; the crossing line denotes orientation preference) and stimulus is shown on the topof the figure (scale bar = 1° of visual angle;cross, area centralis representation). In the examples presented in this figure as well as in the following ones, the drifting gratings were generated on a 100 Hz computer screen. Flashed light squares or moving bars were generated by an optical bench-fitted DC source. In this condition the stimulus is free of any oscillatory component.
Fig. 3.
Fig. 3.
Dependence of oscillation frequency of cortical responses on stimulus orientation. Means of oscillation frequency were plotted as a function of the difference between stimulus orientation and the cells’ preferred orientation (0 and 180° refer to the preferred orientation but opposite directions; for all other orientation differences, the two opposite directions of motion were pooled together because they yielded similar results). Error bars represent 95% confidence intervals. Oscillation frequency is higher when the stimulus does not match the preferred orientation; the effect reaches significance for offsets of 60 and 90° (p < 0.001, ANOVA, Scheffé’s post hoc test).
Fig. 4.
Fig. 4.
Oscillatory patterning of cortical and geniculate oscillations as a function of dynamic and static stimulation conditions. Simultaneous multi-unit recordings were obtained from left A17 and left LGN (lamina A1, dynamic condition) and from left A18 and right LGN (lamina A1, static condition). A, Sliding window autocorrelation functions computed for the two stimulus conditions (left panels, Dynamic; right panels, Static). Drifting gratings induce strong 30–60 Hz oscillations in the cortex that persist during the entire response (top left panel), and high-frequency oscillations in the LGN are limited to the initial phase of the response (bottom left panel). The flashed light stimulus induces high-frequency oscillatory responses of similar frequency in both the cortex and the LGN (top and bottom right panels), oscillatory responses being stronger for LGN than for cortical neurons. B, Absolute change of oscillation frequency after response onset (■, cortex; •, LGN). In theleft panel, two different Y-scales were used (cortical oscillation frequency, left; LGN,right). Time course of the stimulus is indicatedbelow the panels. Calibration, 1000 msec. Sliding correlation analysis window, 200 msec; step, 50 msec.
Fig. 5.
Fig. 5.
Changes of oscillation probability and strength in responses to drifting gratings. A, The modulation amplitude of the first satellite peak (MAS) is plotted for average autocorrelation functions computed from 2000 msec windows placed over the onset (abscissa) and the late (ordinate) phase of the responses. ○, LGN; •, retina. Cases in which oscillations occurred only in the early or the late response epoch are aligned along thex- and y-axes, respectively. Notice that retinal and thalamic oscillations occur preferentially at response onset, because more cases are found below the diagonal or over thex-axis. B, Same analysis for cortical neurons. ○, A17; •, A18. Cortical cells tend to increase oscillatory modulation over time: most points are located above the diagonal.
Fig. 6.
Fig. 6.
Synchronization between the LGN and the cortex of oscillatory responses evoked by the onset and offset of static stimuli.A, Responses to onset recorded simultaneously from left A18 and lamina A1 of the left LGN. Orientation tuning curves for cortical and thalamic recording sites are shown next to the panels. The onset of flashed stimulus-evoked oscillatory responses was at 93 Hz in the LGN and 87 Hz in A18 (autocorrelation functions, left panels). Response synchronization occurs at 91 Hz with a phase shift (ϕ) of 1.7 msec (top right panel). The shift predictor is flat, indicating that the correlation was not time-locked to the stimulus (bottom right panel).B, Simultaneous recordings of OFF responses from left A18 and lamina A of the left LGN. The offset of a light stimulus evokes strong oscillatory responses at 49 Hz in both the LGN and the cortex with a phase shift of 2.6 msec. Note that the shift predictor shows no significant modulation.
Fig. 7.
Fig. 7.
Synchronization between the LGN and the cortex of oscillatory responses evoked by dynamic stimuli. Conventions are the same as in Figure 6. A, Simultaneously recorded responses from left A17 and lamina A of the left LGN. A moving grating matching the tuning of the cortical cell (arrow in tuning curve) evoked oscillatory responses in A17 at 34 Hz (autocorrelation functions, left panels). Geniculate responses were weakly modulated at 106 Hz. Note the weak but significant response synchronization at the cortical frequency with a phase shift of 3.4 msec (top right panel). The shift predictor was not significantly modulated (bottom right panel). B, Simultaneous recordings from left A18 and lamina A of the left LGN. A drifting grating suboptimal for the tuning of the cortical neurons evoked strong oscillatory responses of similar frequency in the LGN and the cortex, and strong synchronization with a phase shift of 0.1 msec. Note that response synchronization was not time-locked to stimulus onset.
Fig. 8.
Fig. 8.
Relation between corticocortical and intrathalamic synchronization. Responses were recorded simultaneously from four separate sites, two in the left A17 and two in the left LGN lamina A1 (top left inset). Drifting gratings with an orientation intermediate to the optimal orientation of the cortical neurons (top right inset) induce strong and stable corticocortical synchronization at a frequency of 33 Hz and a phase shift of 0.8 msec (cross-correlation function, top left panel). The sliding window cross-correlation (analysis window, 250 msec; step, 50 msec) shows that synchronous oscillations do not decay over time (top right panel). In contrast, intrageniculate synchronization occurs only during the initial response epoch (middle panels). There is no significant correlation between the responses of cortical and LGN neurons (bottom panels), indicating that cortical synchronization is independent of oscillatory LGN input. Average cross-correlation functions were computed from the 1000 msec window indicated in the right panels.
Fig. 9.
Fig. 9.
Synchronization between the retina, the LGN, and the cortex of oscillatory responses evoked by a stationary stimulus (top right inset). Responses were recorded simultaneously from the left retina (LRe), right LGN lamina A (RA), and left A18 (LA18,top left inset). A, Autocorrelation functions. The onset of the stimulus evokes strong oscillatory patterning at all sites, at a frequency of 91 Hz. B, Cross-correlation functions. Responses are correlated between all recording pairs. C, The shift predictor controls indicate that this feedforward synchronization is not caused by stimulus locking. The asymmetrical residual modulations are caused by random changes in phase within and across trials of stimulus presentation, and tend to average out, increasing the number of trials.
Fig. 10.
Fig. 10.
Synchronized oscillatory responses in the retina and the cortex after the onset and offset of a static stimulus. Multi-unit activity was recorded from the left retina (LRe) and left A18 (LA18, top left inset). A, The onset of the stimulus (top right inset) evokes oscillatory responses at 102 Hz in the retina, but only weakly oscillatory responses in A18 (autocorrelation functions, left panels). Still, responses are synchronized with a phase shift of 4.3 msec (cross-correlation function, top right panel). As indicated by the shift predictor (bottom right panel), this synchronization is not caused by stimulus locking. B, Stimulus offset evokes oscillatory responses at both sites at lower frequency (around 86 Hz, autocorrelation functions, left panels). Retinal and cortical responses are synchronized with a phase shift of 4.7 msec (cross-correlation function, top right panel). The shift predictor (bottom right panel) excludes stimulus locking.
Fig. 11.
Fig. 11.
Sliding window analysis of retinocortical synchronization (window 250 msec, step 50 msec). Recordings are the same as in Figure 10. Both stimulus onset and offset evoke strong and stable oscillatory responses in the retina at different oscillation frequencies (top left panel). Cortical responses show similar but much weaker oscillatory modulation (bottom left panel). The sliding window cross-correlation analysis shows strong and sustained synchronization of ON responses and strong but more transient synchronization of OFF responses (top right panel). Note the lack of correlations in the shift predictor (bottom right panel). The windows used for computing the correlograms in Figure 9 are depicted by thevertical lines in the two-dimensional plots.
Fig. 12.
Fig. 12.
Box plot of the distribution of oscillation frequencies for all cases of synchronous oscillations. Thehorizontal bars depict the median (50th percentile), the boundaries of the boxes depict the 25th percentile, and the error bars depict the 10th percentile. Note that thalamocortical correlations span the largest frequency range.
Fig. 13.
Fig. 13.
Comparison of oscillation frequency at the two sites of recording pairs exhibiting synchronous oscillations.A, Retina–LGN. B, LGN–cortex.Top plot, LGN–A17; bottom plot, LGN–A18. C, Retina–cortex. Top plot, Retina–A17; bottom plot, retina–A18. Oscillation frequencies at the compared sites are plotted on the x- and y-axis, respectively.
Fig. 14.
Fig. 14.
Box plot of the phase shift distribution for all recording pairs exhibiting significant synchronization. Conventions are the same as in Figure 12. Both oscillatory and nonoscillatory correlograms are included. Positive phase shifts indicate phase advancement of the first site in a recording pair.

References

    1. Abeles M. Corticonics. Neural circuits of the cerebral cortex. Cambridge UP; Cambridge: 1991.
    1. Alonso J-M, Usrey WM, Reid RC. Precisely correlated firing in cells of the lateral geniculate nucleus. Nature. 1996;383:815–819. - PubMed
    1. Arnett DW. Correlation analysis of units recorded in the cat dorsal lateral geniculate nucleus. Exp Brain Res. 1975;24:111–130. - PubMed
    1. Blake R, Camisa R. Temporal aspects of spatial vision in cats. Exp Brain Res. 1977;28:325–333. - PubMed
    1. Cleland BG, Dubin MW, Levick WR. Simultaneous recording of input and output of lateral geniculate neurons. Nature. 1971a;231:191–192. - PubMed

Publication types

LinkOut - more resources