. 1998 Aug 15;18(16):6444-65.
doi: 10.1523/JNEUROSCI.18-16-06444.1998.

Computational models of thalamocortical augmenting responses

Affiliations

Computational models of thalamocortical augmenting responses

M Bazhenov et al. J Neurosci. .

Abstract

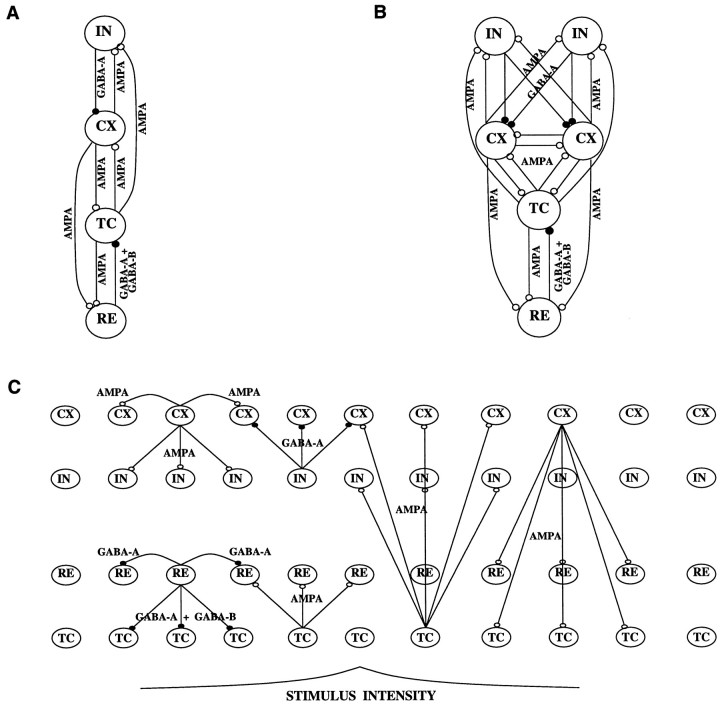
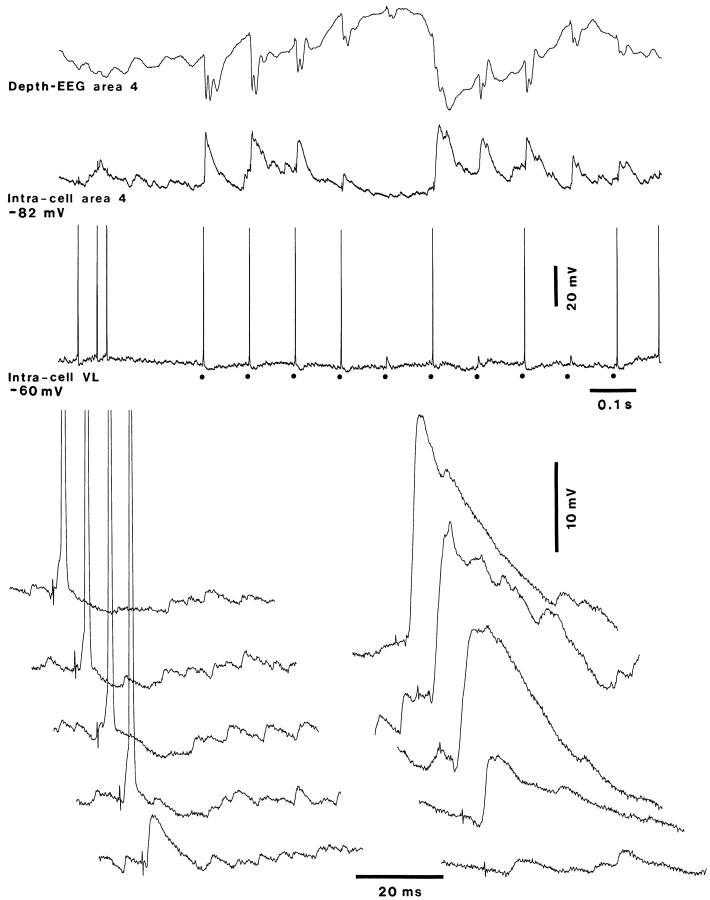
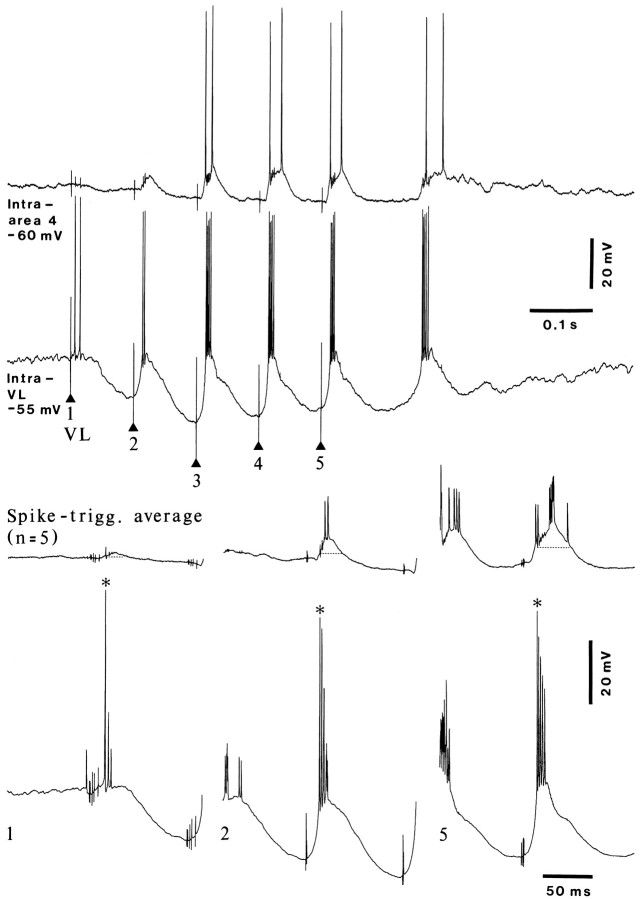
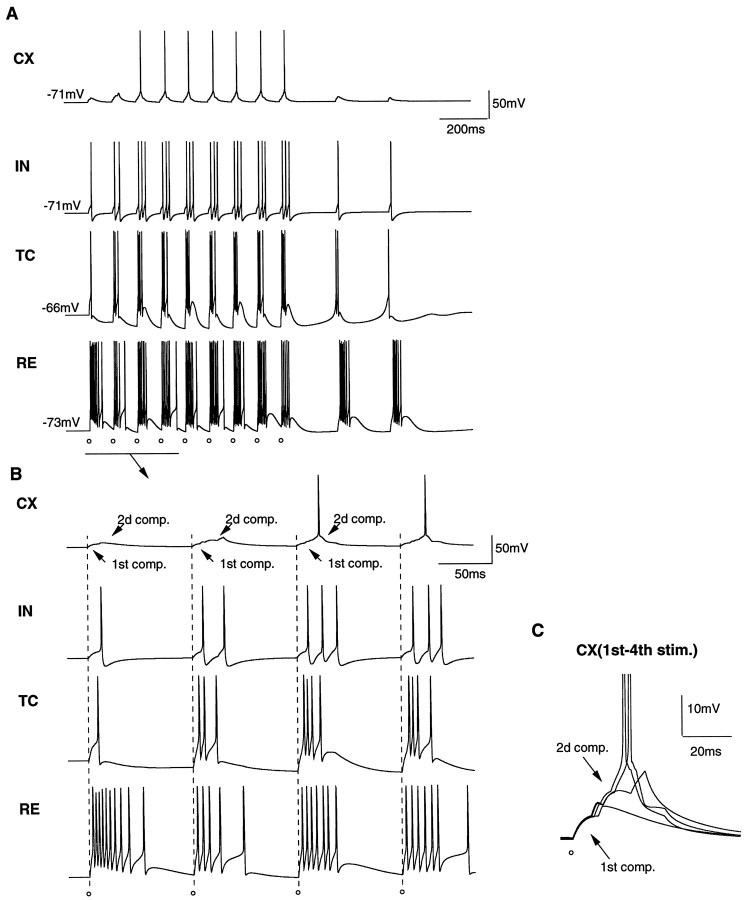
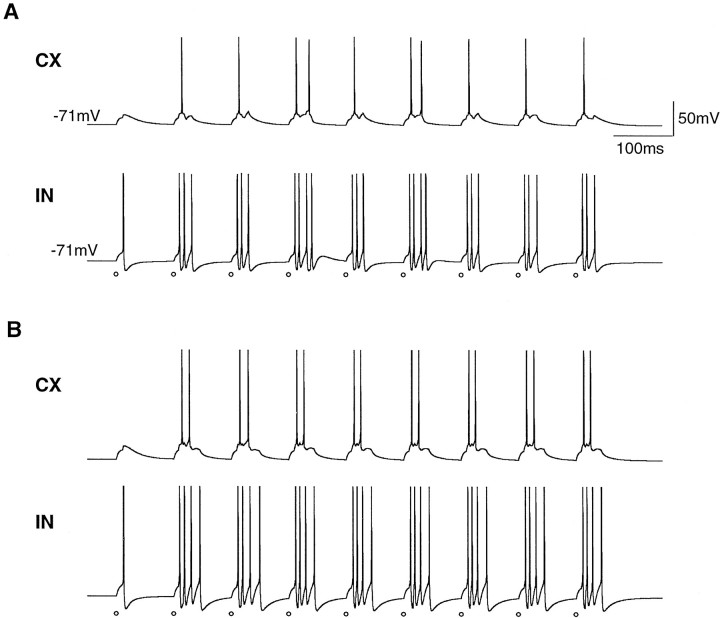
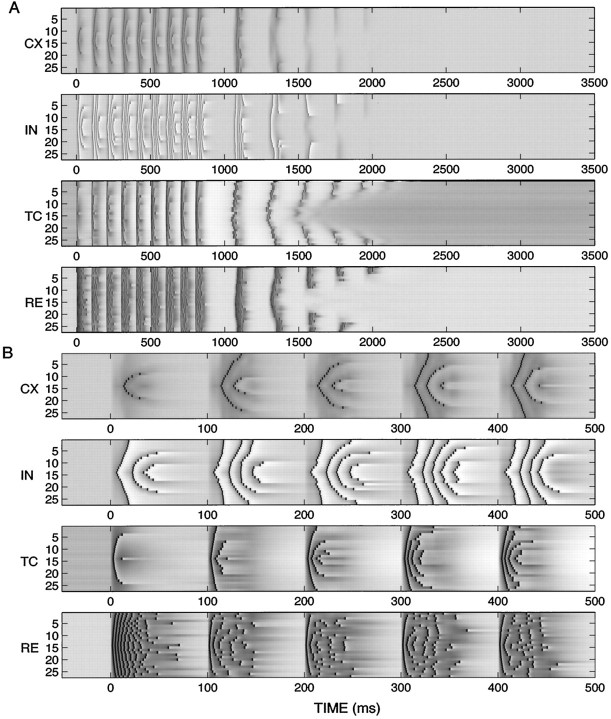
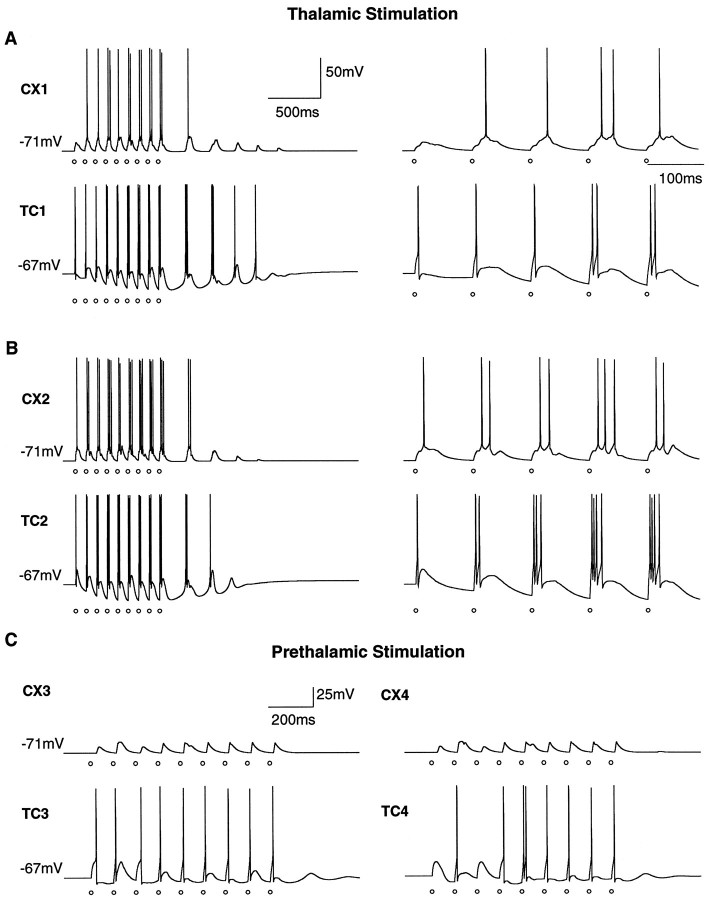
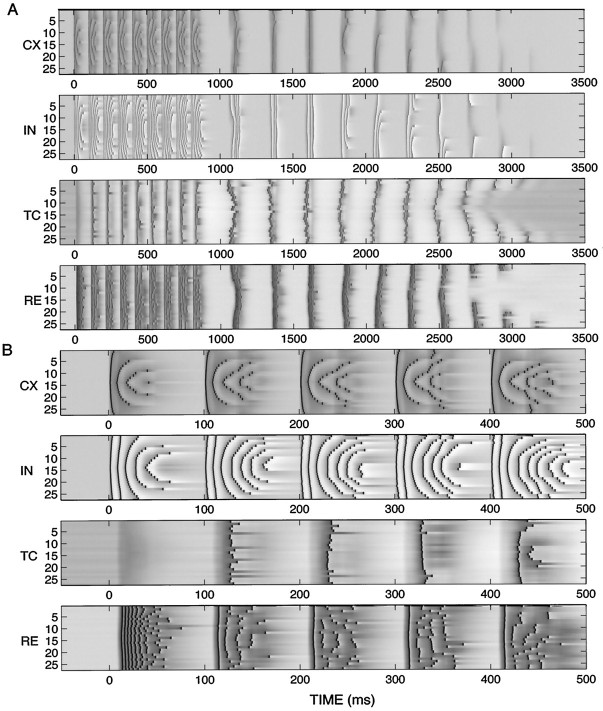
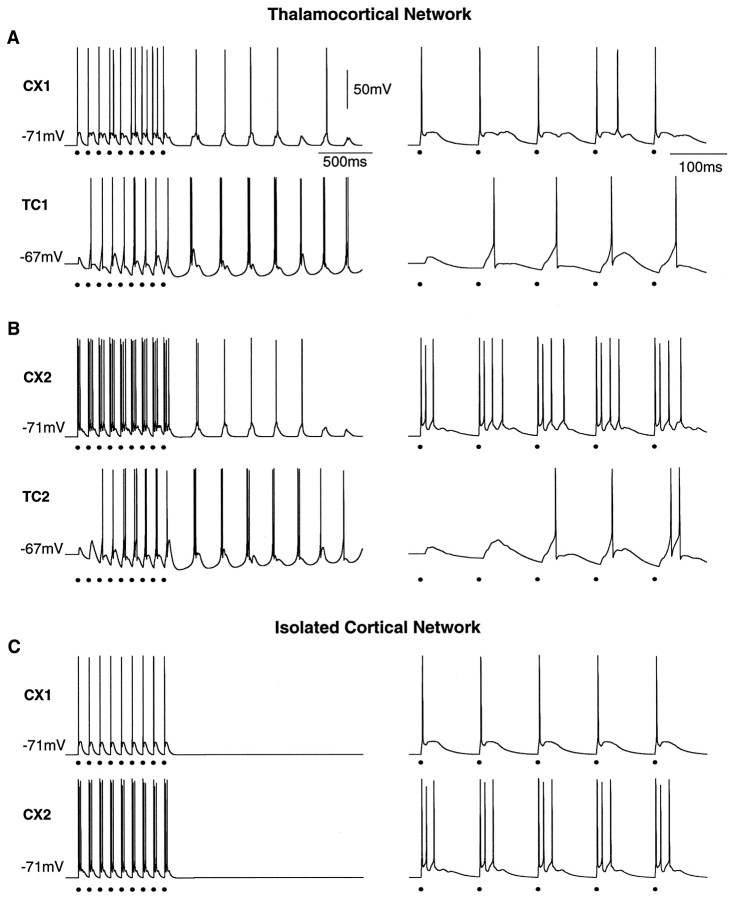
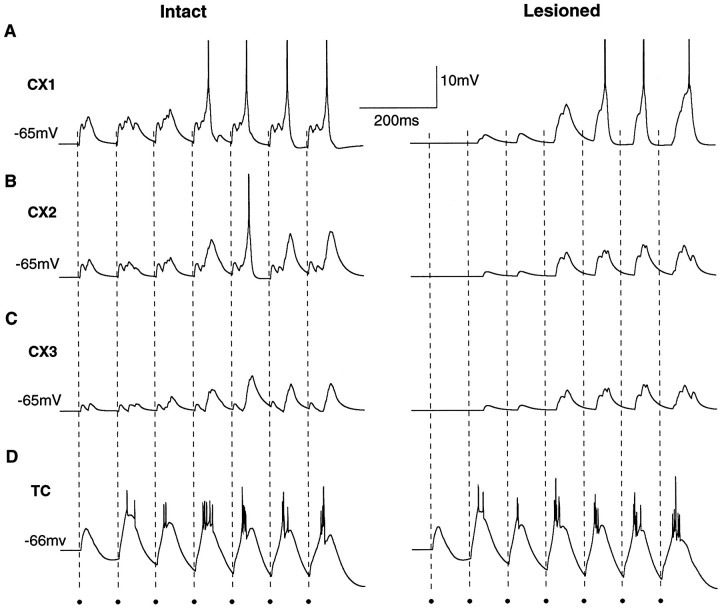
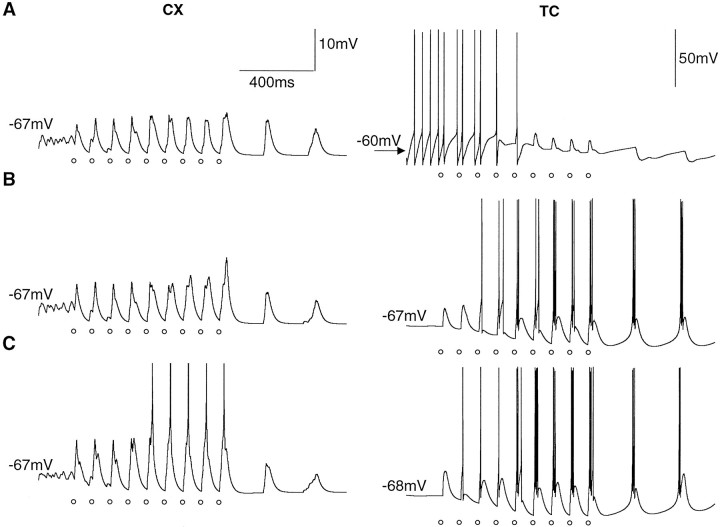
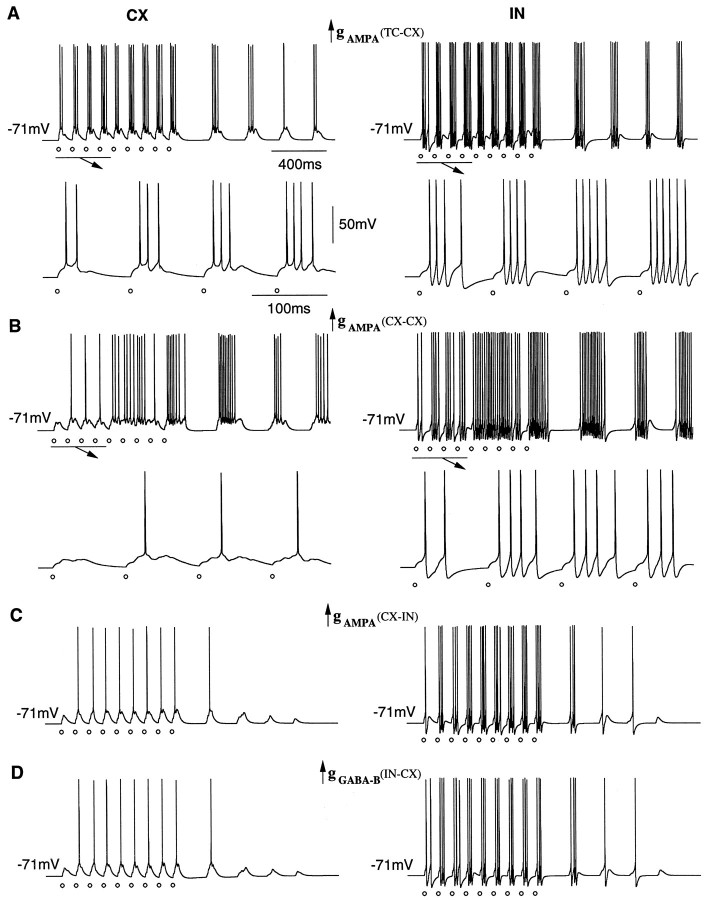
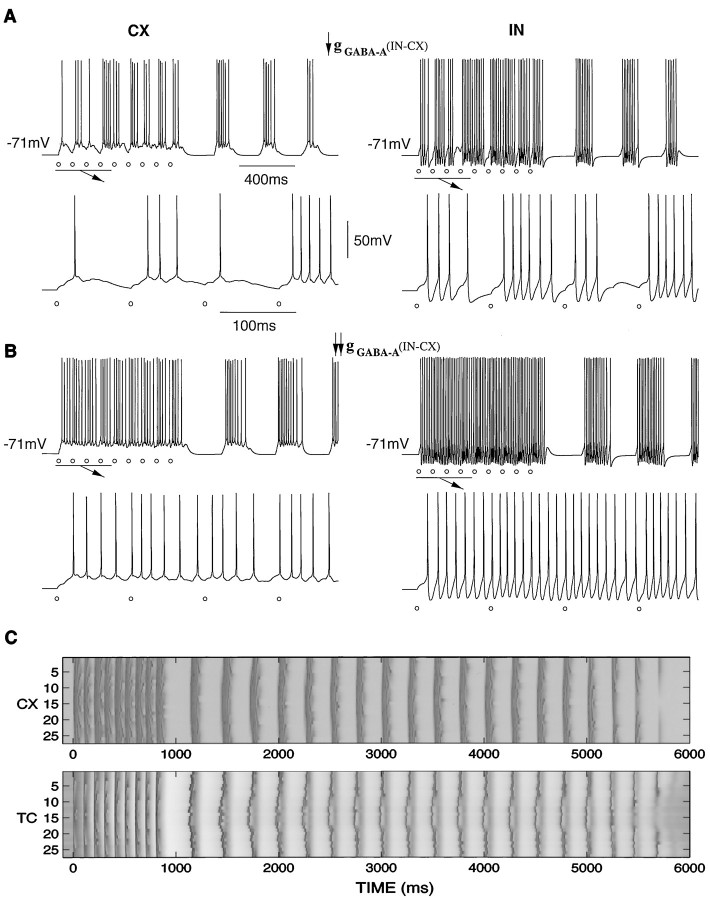
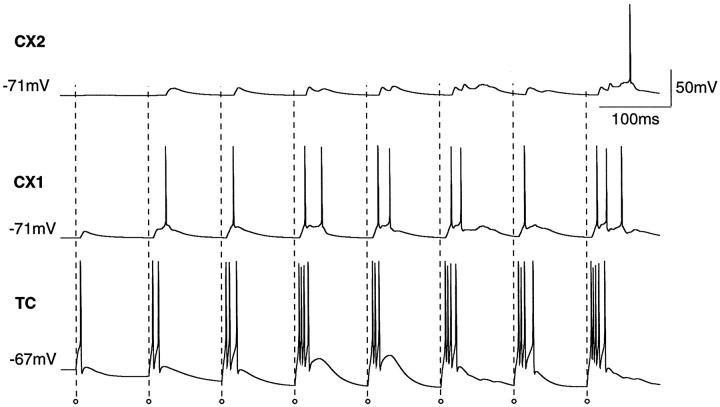
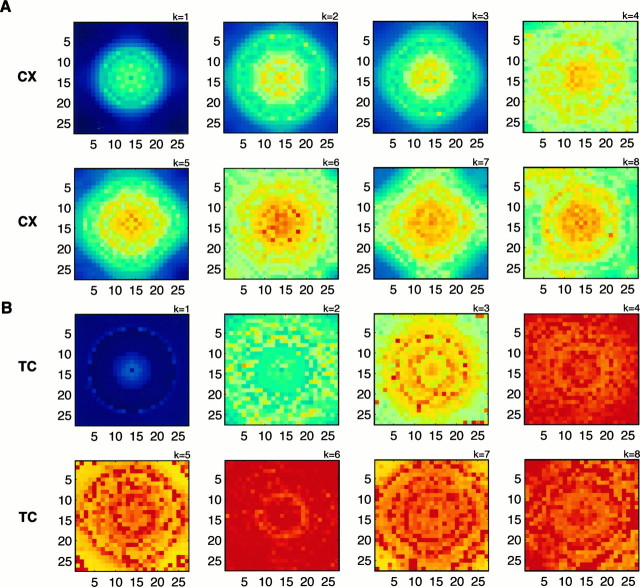
Repetitive stimulation of the dorsal thalamus at 7-14 Hz produces an increasing number of spikes at an increasing frequency in neocortical neurons during the first few stimuli. Possible mechanisms underlying these cortical augmenting responses were analyzed with a computer model that included populations of thalamocortical cells, thalamic reticular neurons, up to two layers of cortical pyramidal cells, and cortical inhibitory interneurons. Repetitive thalamic stimulation produced a low-threshold intrathalamic augmentation in the model based on the deinactivation of the low-threshold Ca2+ current in thalamocortical cells, which in turn induced cortical augmenting responses. In the cortical model, augmenting responses were more powerful in the "input" layer compared with those in the "output" layer. Cortical stimulation of the network model produced augmenting responses in cortical neurons in distant cortical areas through corticothalamocortical loops and low-threshold intrathalamic augmentation. Thalamic stimulation was more effective in eliciting augmenting responses than cortical stimulation. Intracortical inhibition had an important influence on the genesis of augmenting responses in cortical neurons: A shift in the balance between intracortical excitation and inhibition toward excitation transformed an augmenting responses to long-lasting paroxysmal discharge. The predictions of the model were compared with in vivo recordings from neurons in cortical area 4 and thalamic ventrolateral nucleus of anesthetized cats. The known intrinsic properties of thalamic cells and thalamocortical interconnections can account for the basic properties of cortical augmenting responses.


Figures

Fig. 1.
Fig. 1.
The structure of synaptic interconnections in the thalamocortical network. A, Minimal model of 1 × 4 RE-TC-CX-IN cells. The open circles denote the excitatory (AMPA) synapses, and the filled circles denote the inhibitory (GABAA and GABAB) synapses. B, Model of 1 × 2 RE-TC and 2 × 2 CX-IN cells with lateral intracortical connections. C, Structure of the four-layer chain of RE, TC, CX, and IN cells. Diameter of connections is nine cells for intrathalamic RE→TC, RE→RE, TC→RE and intracortical CX→IN, CX→CX, IN→CX projections and 17 cells for thalamocortical CX→TC, CX→RE, TC→CX, TC→IN projections. The intensity of stimulation is maximal in the center of the chain and decays exponentially with distance from the center.
Fig. 2.
Fig. 2.
Stimulation of cerebellothalamic projection pathways (brachium conjunctivum) does not elicit an augmenting response. Simultaneous recording of depth EEG and a cortical cell from area 4 and a TC cell from the VL nucleus. Stimulus pulse train at 10 Hz indicated by dots. Expansion of the early parts of responses to the first 5 stimuli of VL cell (bottom left) and cortical cell (bottom right) is shown. Stimulation of brachium conjunctivum reveals a monosynaptic EPSPs in the TC cell leading to spikes. When hyperpolarization during depth positivity in the EEG prevents the TC cell from firing, the cortical cell has a smaller-amplitude EPSP. The responsiveness of thalamic and cortical cells is affected by the slow oscillation but does not increment during the train of stimuli.
Fig. 3.
Fig. 3.
Thalamic rebound spike bursts deinactivated by hyperpolarization during augmenting responses precede the depolarizing augmented responses in cortical neuron. Ketamine–xylazine anesthesia. Dual intracellular recording from VL and area 4 neurons. VL stimulated at 10 Hz. Averages ( n = 5) triggered by the first action potentials (asterisks) of the first, second, and fifth responses of VL neuron show that they precede the late, augmented depolarization (dotted line) in area 4.
Fig. 4.
Fig. 4.
Augmenting responses in the minimal model of RE-TC-CX-IN cells during repetitive 10 Hz stimulation. Both the RE and TC cells were stimulated with 100% of maximal intensity, and the CX and IN cells were stimulated with 10% of maximal intensity. A, Monosynaptic stimulation of the CX cell elicited a nonaugmenting component in the cortical EPSPs that occurred simultaneously with EPSPs in the RE and TC cells. Augmenting spike bursts in TC cells lead to a growing secondary EPSPs in the CX cell. B, Same response shown on a shorter time scale. C, Superimposed traces of the first four EPSPs in a CX cell.Open circles indicate the time of thalamic stimulation (gAMPA = 0.1 μS from CX to IN, gAMPA = 0.1 μS from CX to TC, gAMPA = 0.2 μS from CX to RE, gGABAA = 0.03 μS from IN to CX, gAMPA = 0.035 μS from TC to CX, and gAMPA = 0.02 μS from TC to IN).
Fig. 5.
Fig. 5.
Influence of afferent (TC→CX) and lateral (CX→CX) connections on cortical augmenting responses. A, The same circuit of RE-TC-CX-IN cells as shown in Figure 1A during repetitive RE-TC (100% maximal intensity) and CX-IN (10% maximal intensity) stimulation for gAMPA = 0.06 μS from TC to CX cells. The other parameters are the same as for Figure 4. Increasing the maximal conductance of TC→CX synaptic connections produced a stronger augmentation of CX responses (compare A, Fig. 4A). B, Augmenting responses in a chain of six RE-TC-CX-IN cells shown in Figure 1B. The lateral AMPA excitation between CX cells (gAMPA = 0.1 μS) increases the number of spikes in the augmenting responses. Note that both CX and IN cells have stronger augmenting responses.Open circles indicate the time of thalamic stimulation.
Fig. 6.
Fig. 6.
Thalamocortical augmenting responses in a chain with 27 × 4 RE-TC-CX-IN cells in response to thalamic stimulation. A, 10 Hz train of stimuli for 1 sec. Both RE and TC cells were stimulated at 100% maximal intensity, and CX-IN cells were stimulated with 10% of maximal intensity. The intensity of stimulation was maximal at the center of the network and decayed exponentially with distance from the center. B, Expanded traces from A between t = −50 msec and t = 500 msec. The first four shocks in the train of nine shocks evoked a low-threshold augmenting response in the TC cells and an increasing number of spikes in CX cells (from 0 or 1 spike to 1–3 spikes) and IN cells (from 1–3 spikes to 3 or 4 spikes). Slow (∼3 Hz) post-stimulus oscillations in the RE-TC network are echoed in the CX-IN cells. These oscillations terminated after four or five cycles as the spiking of the neurons in the network desynchronized (gAMPA = 0.1 μS between CX cells, gAMPA = 0.1 μS from CX to IN, gAMPA = 0.1 μS from CX to TC, gAMPA = 0.2 μS from CX to RE, gGABAA = 0.03 μS from IN to CX, gAMPA = 0.08 μS from TC to CX, and gAMPA = 0.03 μS from TC to IN).
Fig. 7.
Fig. 7.
Comparison of augmenting responses in the thalamocortical (RE-TC-CX-IN) network evoked by intrathalamic (RE-TC) and prethalamic (TC only) stimulation. The responses to the first five stimuli are shown on the right on an expanded time scale. A, B, Two CX and two TC cells from an intact thalamocortical network during 10 Hz intrathalamic stimulation. CX cell responses have two components: the first EPSP is stereotyped, and the augmentation of the second EPSP depends on the position of the cell in the network. A, Far from the center of the network, the TC cell receives low-intensity stimulation and displays a weak augmenting response. The secondary EPSPs in the corresponding cortical cells were smaller, and the augmenting response was delayed. B, TC cells near the center of stimulation had strong augmenting responses that induced fast augmentation of CX responses during a train of stimuli. C, Two TC and two CX cells during weak prethalamic stimulation (gext = 0.145 μS). The stereotyped single-spike responses of TC cells elicited nonaugmenting EPSPs in CX cells. Open circles indicate the time of thalamic stimulation.
Fig. 8.
Fig. 8.
Thalamocortical augmenting responses in a chain of 24 × 4 RE-TC-CX-IN cells in response to cortical stimulation of both the CX and IN cells. A, 10 Hz train of stimuli for 1 sec. The intensity of stimulation was maximal at the center of the network and decayed exponentially with distance from the center. B, Expanded traces from A between t = −50 msec and t = 500 msec. The RE-TC network elicited low-threshold augmenting responses (up to two spikes in TC cells). Action potentials of TC cells produced increasing secondary EPSPs in CX cells. The train of stimuli was followed by prolonged (up to 9 cycles) oscillations at ∼3 Hz (gAMPA = 0.1 μS between CX cells, gAMPA = 0.1 μS from CX to IN, gAMPA = 0.1 μS from CX to TC, gAMPA = 0.2 μS from CX to RE, gGABAA = 0.03 μS from IN to CX, gAMPA = 0.08 μS from TC to CX, and gAMPA = 0.03 μS from TC to IN).
Fig. 9.
Fig. 9.
Comparison of augmenting responses in the thalamocortical network (RE-TC-CX-IN) in response to cortical stimulation and comparison with an isolated cortical network (CX-IN). The responses to the first five stimuli are shown on theright on an expanded time scale. Two CX and two TC cells from intact an thalamocortical network during 10 Hz stimulation are shown. A, Direct cortical stimulation evoked single-spike responses in the CX cells far from the center of the network. B, Responses of a CX cell near the center of the network. Augmentation of the TC responses produced a growing secondary EPSP in the cortical cell and additional fast spike. C, Stereotyped responses of the same CX cells after removing the thalamic (RE-TC) network. Filled circles indicate the time of cortical stimulation.
Fig. 10.
Fig. 10.
The influence of the CX-TC-CX loop on the augmenting responses in cortical neurons distant from the site of stimulation. Repetitive 10 Hz stimulation of half of the cortical network (CX-IN cells from 1–13) produced augmenting responses of the CX cells from the second half of the cortical network: A, CX cell 15; B, CX cell 16; C, CX cell 17. Responses from an intact thalamocortical model shown on the left.Secondary EPSPs in CX cells were from activation of the lateral (CX→CX) and corticothalamocortical (CX→TC→CX) connections. Lesion of the lateral connections between the two halves of the cortical network eliminated the initial EPSPs in CX cells as shown on theright. D, The averaged responses of the TC cells contributing to the EPSPs in the CX cells shown in A–C (TC cells 7–25). Filled circles indicate the time of cortical stimulation (gAMPA = 0.1 μS between CX cells, gAMPA = 0.1 μS from CX to IN, gAMPA = 0.1 μS from CX to TC, gAMPA = 0.2 μS from CX to RE, gGABAA = 0.03 μS from IN to CX, gAMPA = 0.1 μS from TC to CX, and gAMPA = 0.03 μS from TC to IN).
Fig. 11.
Fig. 11.
Thalamocortical augmenting responses during a train of 10 Hz stimuli in the presence of spontaneous TC-evoked depolarization of the cortical network. Both RE and TC cells were stimulated. A, CX and TC cells far from the center of stimulation. B, CX and TC cells at an intermediate distance. C, CX and TC cells close to the center of stimulation. The EPSPs is the CX cells augmented despite hyperpolarization from disfacilitation of the spontaneous TC-evoked depolarization that began before the train of stimuli. Open circles indicate the time of thalamic stimulation (gAMPA = 0.1 μS between CX cells, gAMPA = 0.1 μS from CX to IN, gAMPA = 0.1 μS from CX to TC, gAMPA = 0.2 μS from CX to RE, gGABAA = 0.03 μS from IN to CX, gAMPA = 0.05 μS from TC to CX, and gAMPA = 0.03 μS from TC to IN).
Fig. 12.
Fig. 12.
Effect of the intracortical synaptic connections on the augmenting responses in cortical cells. One CX-IN pair from a network of 27 × 4 cells is shown during repetitive 10 Hz stimulation. Parameters are the same as in Figure 7A except as noted below. A, Increase of TC-evoked EPSPs in CX and IN cells produced enhancement of the cortical augmenting responses (compare A, Fig. 7A) (gAMPA = 0.15 μS from TC to CX cells). B, Enhancement of the lateral excitation evoked strong depolarization in the CX cell after the fifth stimulus and transformed the CX responses to tonic firing (gAMPA = 0.15 between CX cells). C, Increase of CX evoked EPSPs in IN cells enhanced responses in these cells and reduce augmenting responses in CX cells (gAMPA = 0.15 μS from CX to IN cells). D, Weak GABAB inhibition progressively hyperpolarized the CX cells after four or five shocks. This weakened the augmenting responses in CX cells (compare D, Fig.7A) (gGABAB = 0.01 μS from IN to CX cells). Open circles indicate the time of thalamic stimulation.
Fig. 13.
Fig. 13.
Influence of intracortical IN→CX inhibition on thalamocortical augmenting responses. A, B, CX-IN pair responding to a repetitive 10 Hz stimulation (Fig. 7A). Parameters are the same as in Fig. 7A, except as noted below. A, Decreasing the IN-evoked inhibition produced strong augmentation of CX responses (from 1 to 3–5 spikes) accompanied by progressive depolarization of the membrane potential (gGABAA = 0.01 μS from IN to CX cells). B, Weak inhibition produced strong depolarization during a train of stimuli and elicited tonic firing in CX cells that terminated after the train (gGABAA = 0.005 μS from IN to CX cells). C, Shift in the balance between excitation and inhibition in CX cells toward excitation accompanied by strengthening of the afferent TC→CX synaptic connections prolonged the slow poststimulus oscillations (compare C, Fig. 7A) (gGABAA = 0.01 μS from IN to CX cells, and gAMPA = 0.014 μS from TC to CX cells). Open circles indicate the time of thalamic stimulation.
Fig. 14.
Fig. 14.
Augmenting responses in a thalamocortical network model that included two layers of cortical cells. One pair of cortical cells from the two layers and one TC cell are shown during 10 Hz cortical stimulations. CX1 is an input cell receiving direct TC connections, and CX2 is an output cell sending connections to the thalamus. The CX2 cell had a reduced augmenting response compared with the CX1 cells because of the feedforward IN-evoked inhibition. Open circles indicate the time of thalamic stimulation (gAMPA = 0.1 μS between CX1 cells and CX2 cells, gAMPA = 0.1 μS from CX1 to CX2 and from CX2 to CX1, gAMPA = 0.03 μS from CX1 to IN and from CX2 to IN, gGABAA = 0.06 μS from IN to CX1 and IN to CX2, gAMPA = 0.1 μS from CX2 to TC, gAMPA = 0.2 μS from CX2 to RE, gAMPA = 0.11 μS from TC to CX1, and gAMPA = 0.03 μS from TC to IN).
Fig. 15.
Fig. 15.
Thalamocortical augmenting responses in a two-dimensional thalamocortical network with 27 × 27 × 4 RE-TC-CX-IN cells in response to thalamic stimulation. Both RE and TC cells were stimulated at 100% of maximal intensity, and the CX-IN cells were stimulated with 10% of maximal intensity by the train of eight shocks (gAMPA = 0.1 μS between CX cells). The intensity of stimulation was maximal at the center of the network and decayed exponentially with distance from the center. Each panel displays the average depolarization V¯i,j(k) (see Materials and Methods) (i, j = 1, … , 27) in the CX or TC networks after a stimulus in the train (k = 1, … , 8). The values of V¯i,j(k) are coded by color, ranging from 2 mV (blue) to 25 mV (red) for TC cells (A) and from 2 mV (blue) to 12.5 mV (red) for CX cells (B) (gAMPA = 0.1 μS between CX cells, gAMPA = 0.1 μS from CX to IN, gAMPA = 0.1 μS from CX to TC, gAMPA = 0.2 μS from CX to RE, gGABAA = 0.03 μS from IN to CX, gAMPA = 0.07 μS from TC to CX, and gAMPA = 0.03 μS from TC to IN).

References

    1. Avoli M. Inhibitory potentials in neurons of the deep layers of the in vitro neocortical slices. Brain Res. 1986;370:165–170. - PubMed
    1. Bal T, McCormick DA. What stops synchronized thalamocortical oscillations? Neuron. 1996;17:297–308. - PubMed
    1. Bazhenov M, Timofeev I, Steriade M, Sejnowski TJ. Cellular and network models for intrathalamic augmenting responses during 10 Hz stimulation. J Neurophysiol. 1998;79:2730–2748. - PubMed
    1. Castro-Alamancos MA, Connors BW. Spatiotemporal properties of short-term plasticity in sensorimotor thalamocortical pathways of the rat. J Neurosci. 1996a;16:2767–2779. - PMC - PubMed
    1. Castro-Alamancos MA, Connors BW. Cellular mechanisms of the augmenting response: short-term plasticity in a thalamocortical pathway. J Neurosci. 1996b;16:7742–7756. - PMC - PubMed

Publication types

LinkOut - more resources