. 1998 Aug 15;18(16):6466-79.
doi: 10.1523/JNEUROSCI.18-16-06466.1998.

Evidence that trigeminal brainstem interneurons form subpopulations to produce different forms of mastication in the rabbit

Affiliations

Evidence that trigeminal brainstem interneurons form subpopulations to produce different forms of mastication in the rabbit

K Westberg et al. J Neurosci. .

Abstract

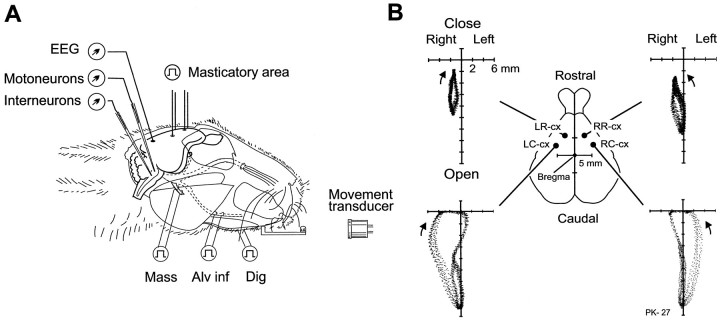
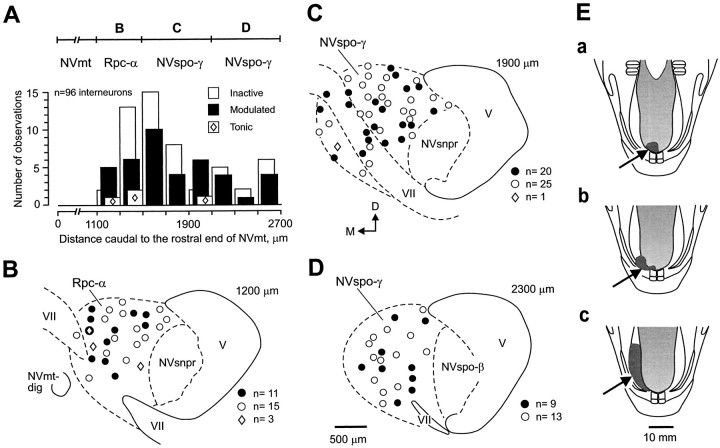
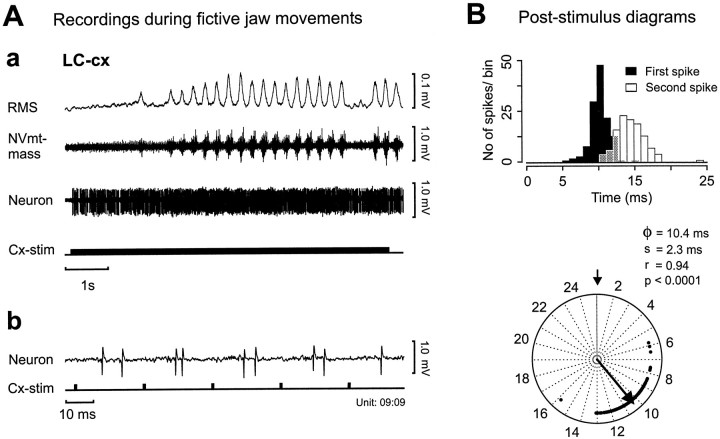
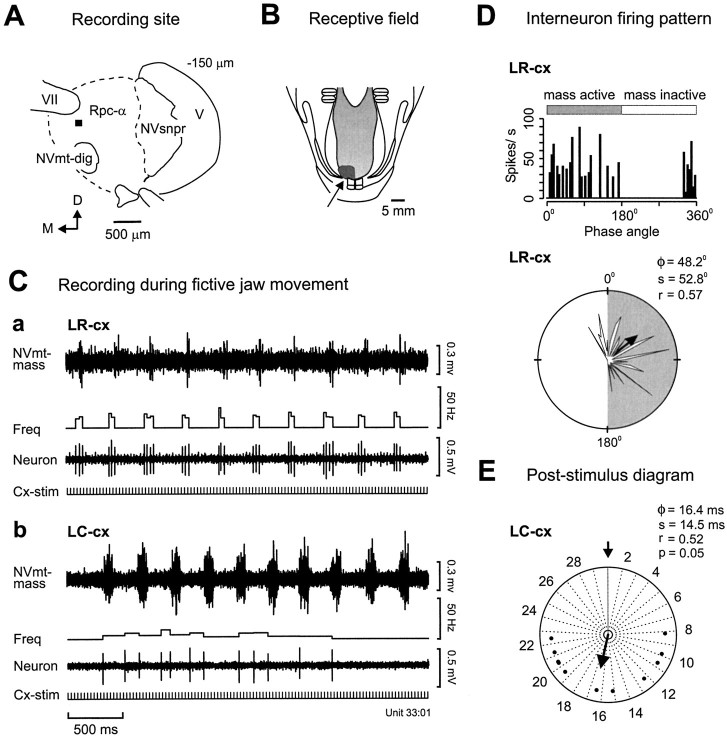
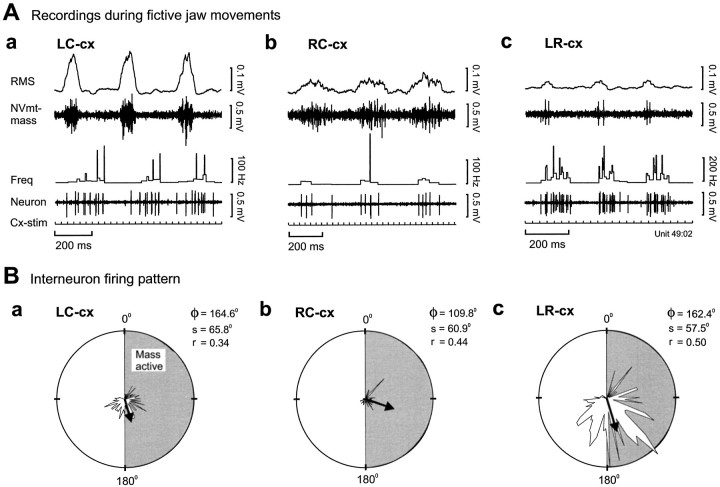
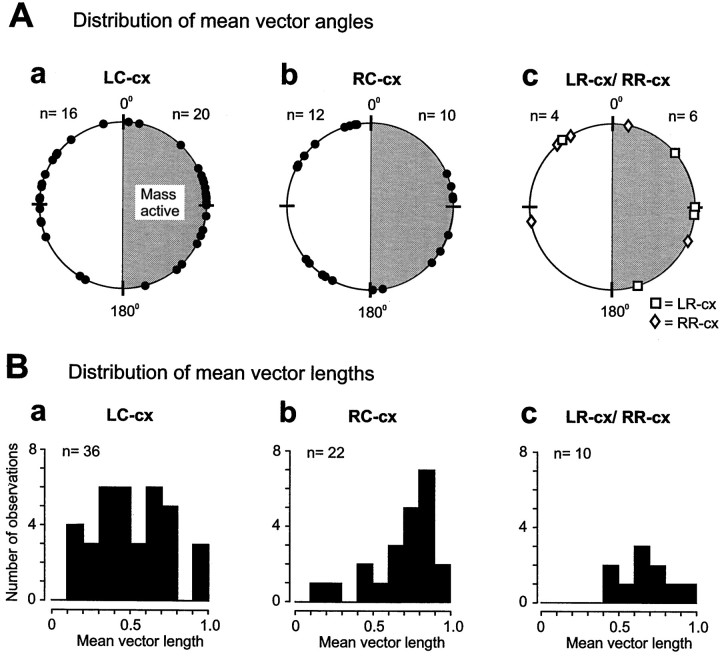
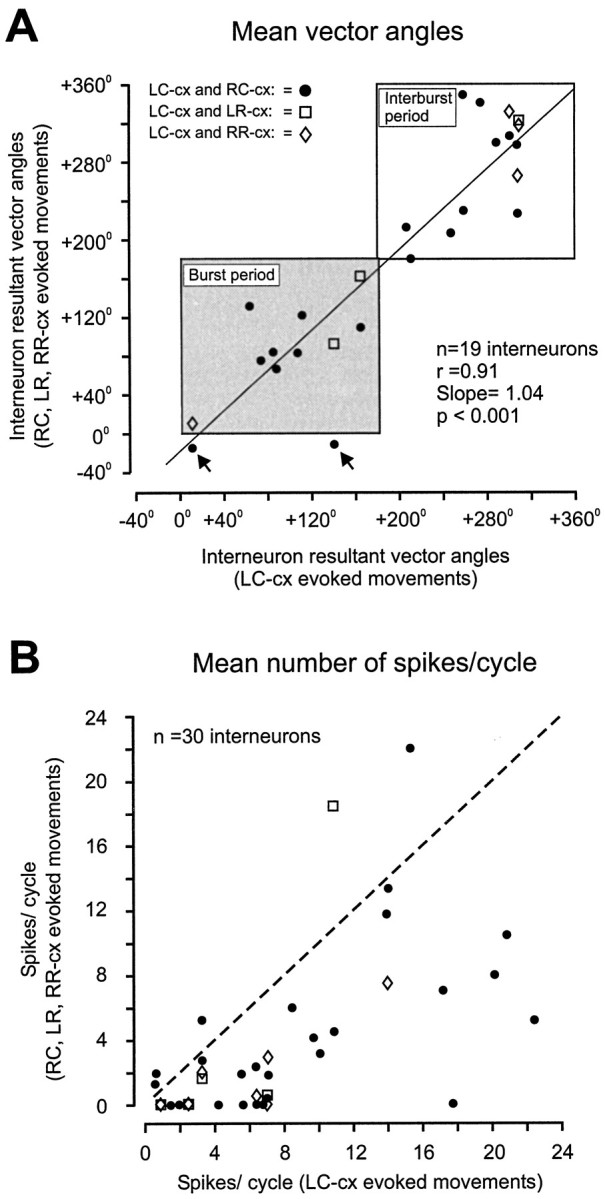
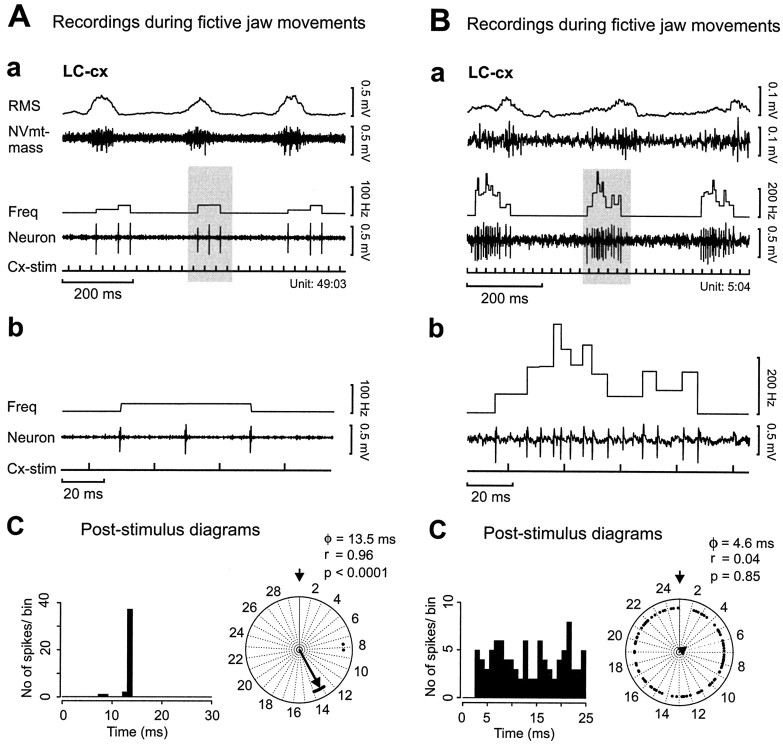
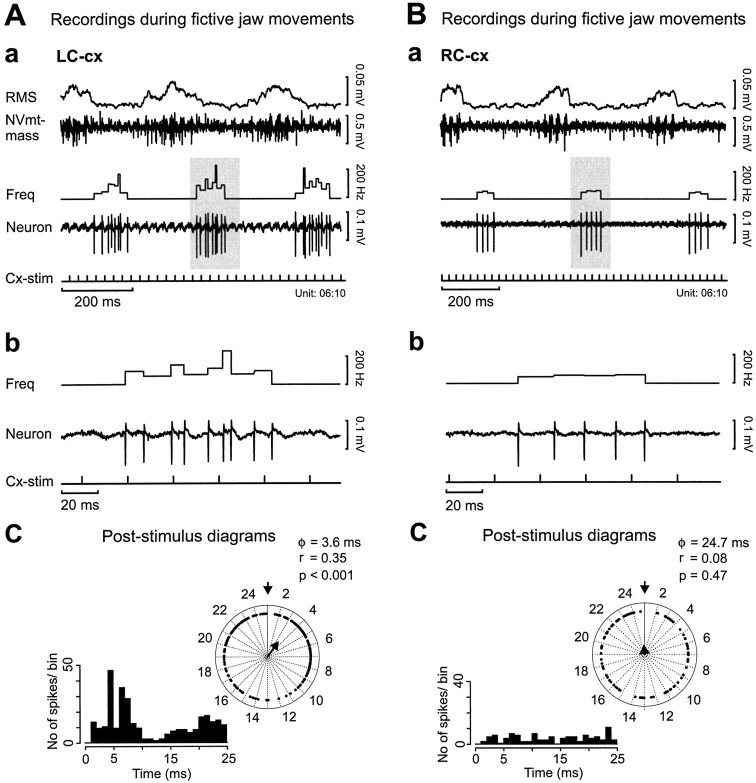
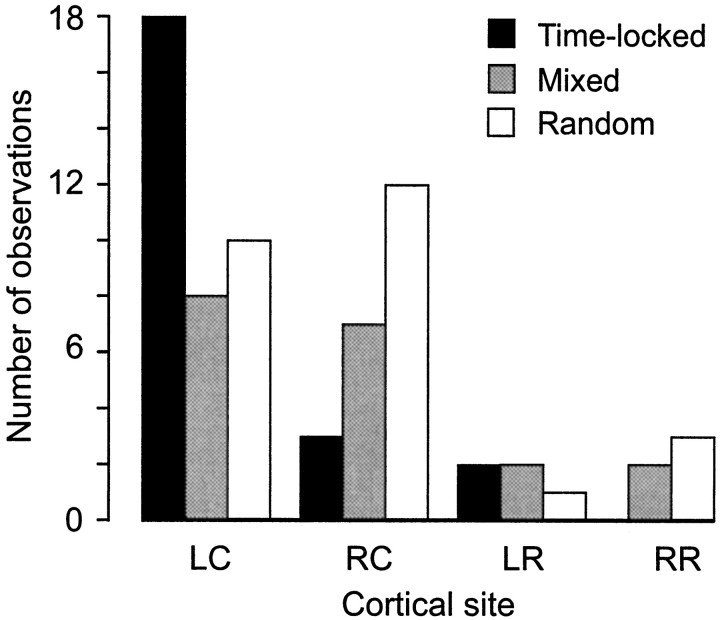
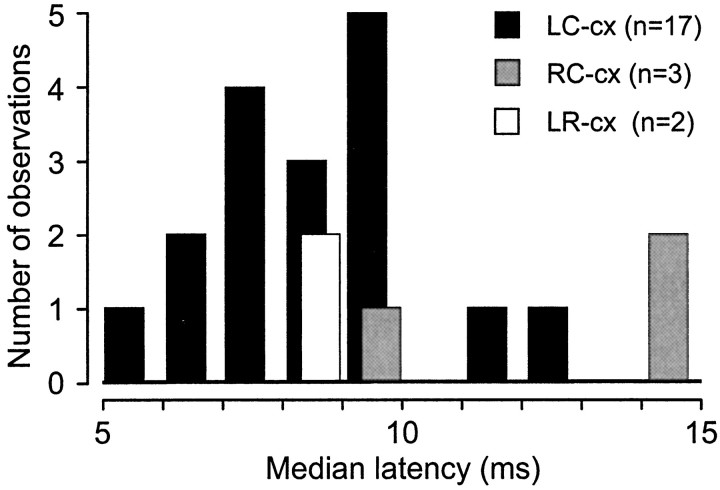
To determine how trigeminal brainstem interneurons pattern different forms of rhythmical jaw movements, four types of motor patterns were induced by electrical stimulation within the cortical masticatory areas of rabbits. After these were recorded, animals were paralyzed and fictive motor output was recorded with an extracellular microelectrode in the trigeminal motor nucleus. A second electrode was used to record from interneurons within the lateral part of the parvocellular reticular formation (Rpc-alpha, n = 28) and gamma- subnucleus of the oral nucleus of the spinal trigeminal tract (NVspo-gamma, n = 68). Both of these areas contain many interneurons projecting to the trigeminal motor nucleus. The basic characteristics of the four movement types evoked before paralysis were similar to those seen after the neuromuscular blockade, although cycle duration was significantly decreased for all patterns. Interneurons showed three types of firing pattern: 54% were inactive, 42% were rhythmically active, and 4% had a tonic firing pattern. Neurons within the first two categories were intermingled in Rpc-alpha and NVspo-gamma: 48% of rhythmic neurons were active during one movement type, 35% were active during two, and 13% were active during three or four patterns. Most units fired during either the middle of the masseter burst or interburst phases during fictive movements evoked from the left caudal cortex. In contrast, there were no tendencies toward a preferred coupling of interneuron activity to any particular phase of the cycle during stimulation of other cortical sites. It was concluded that the premotoneurons that form the final commands to trigeminal motoneurons are organized into subpopulations according to movement pattern.


Figures

Fig. 1.
Fig. 1.
Illustration of the experimental setup.A, Drawing showing stimulation and recording sites. Different types of jaw movement patterns were evoked by stimulation of four separate zones within the masticatory area of the cerebral cortex and recorded with a photoelectric movement transducer system. After paralysis, one microelectrode placed within the masseter motoneuron pool (Motoneurons) was used to monitor the fictive jaw movement. The interneuron activity (Interneurons) was simultaneously recorded with a second electrode placed within the trigeminal subnuclei caudal to the trigeminal motor nucleus.B, Diagram of the dorsal surface of the cerebral cortex showing stimulation sites and superimposed plots of evoked jaw movements (n = 6), projected onto a frontal plane.Arrows indicate the direction of movement. Note the vertical movement types evoked by repetitive stimulation of the rostral cortical sites (LR-cx and RR-cx) and the lateral displacements of the jaw (right andleft) during movements evoked from the left (LC-cx) and right (RC-cx) caudal cortex.
Fig. 2.
Fig. 2.
Illustration of distribution, location, and receptive fields of the recorded interneurons. A, Histogram showing the number of cells that were inactive, rhythmical, or tonic during fictive mastication (see key in figure).B–D, Composite maps showing the neuron distribution. Each diagram has been drawn from histological sections obtained in one of the animals. The number above each section indicates its position relative to the rostral end of the trigeminal motor nucleus (see A). The property of each neuron is indicated (key in A). E, Intraoral views of the mandible and the tongue showing three examples of locations and sizes of receptive fields (shaded areasindicated by arrows). Most neurons had small receptive fields located in the anterior part of the oral cavity, either on the tip of the tongue (a) or on the mucosa lingual and lateral to the right incisor tooth (b). A minority had larger receptive fields that extended toward the molar region (c). D, Dorsal;NVmt-dig, digastric subnucleus of the trigeminal motor nucleus; NVsnpr, main sensory trigeminal nucleus;NVspo-β, subnucleus-β of the oral nucleus of the trigeminal tract; M, medial; V, trigeminal tract; VII, facial nerve. See Results for other abbreviations.
Fig. 3.
Fig. 3.
Example of a tonically active interneuron recorded in Rpc-α, ∼800 μm caudal to NVmt. Aa, Masseter motoneuron activity (NVmt-mass) and interneuron (Neuron) firing during fictive mastication evoked by train stimulation (Cx-stim; 0.5 msec, 40 Hz) of the left caudal masticatory area. Ab, Record to show the robust time-coupling between the cortical stimulus pulses and interneuron action potentials. B, Post-stimulus latency histogram of unit action potentials during the cortical stimulus period. The cortical stimulus pulse occurred at time 0 (binwidth, 1 msec). Eachdot in the circular plot shows the latency of the first spike relative to the start of the stimulus. The trigonometrically calculated preferred latency of the spikes (mean vector angle, φ) and their concentration (mean vector length, r) are indicated by the arrow. These values are also shown above the diagram together with the probability of a response without directionality (i.e., that the spikes are not time-coupled to the preceding cortical pulse). In the analysis, the first millisecond has been discarded because of post-stimulus blanking of the amplifier.
Fig. 4.
Fig. 4.
Example of a rhythmically active neuron during fictive mastication. A, Drawings of sections showing positions at which the interneuron (▪) recording was performed.B, Intraoral receptive field of the recorded interneuron at the tip of the tongue (arrow). C, Top traces show masseter motoneuron activity and interneuron firing evoked by train stimulation (Cx-stim; 0.5 msec, 33 Hz) of the left rostral and left caudal masticatory areas. Phase histogram and descriptive circular representation of the mean interneuron firing frequency averaged over 20 cycles during the LR-cx movement. Thegray-shaded bar and sector mark the length of the masseter burst normalized to half of the cycle (0–180°). Thearrow represents the trigonometrically calculated preferred direction (mean vector angle, φ; s = angular deviation) and concentration (vector length, r) of the interneuron activity. The radius of the circle represents both a spike frequency of 100 Hz and a vector length of 1.0. E, Circular plot of corticoneuronal post-stimulus spike latencies during fictive mastication evoked from the LC-cx.
Fig. 5.
Fig. 5.
Example of an interneuron that was rhythmically active during two forms of fictive mastication. A, Masseter motoneuron activities and interneuron firing during fictive mastication evoked by train stimulation (0.5 msec, 40 Hz) applied to the LC-cx (a) andRC-cx (b). The RMSsignal was used to outline the motoneuron burst period. Thehorizontal line indicates the highest level of the interburst activity (Aa). The masseter motoneuron burst phase was defined as the time during which the activity was above the peak of the interburst level. The left parts show recordings taken halfway through the movement sequence. Data obtained from the end of the masticatory sequence after the cessation of the cortical stimulation are shown to the right. B, Phase histograms and descriptive circular representation of the interneuron firing. Radius = 200 Hz and a vector length of 1.0. For additional details, see Figure 4.
Fig. 6.
Fig. 6.
A, Recordings from a rhythmically active interneuron during fictive mastication evoked from three separate sites within the sensorimotor cortex. B, Circular plots of mean unitary firing during each form of movement. Radius = 350 Hz; vector length, 1.0.
Fig. 7.
Fig. 7.
Distribution of mean vector angles (A) and mean vector lengths (B) observed in the sampled population of rhythmically active interneurons during fictive mastication. Note that cells with short mean vector lengths (r < 0.1;n = 4) were excluded from the sample because they were classified as tonic according to the Rayleigh test (p > 0.05).
Fig. 8.
Fig. 8.
Scatter plots illustrating alternations in unit mean vector angles (A) and mean number of spikes per movement cycle (B) during LC-cx movements (horizontal axis) and RC-cx, LR-cx, and RR-cx movements (vertical axis). Boxed areas inA show periods during which the masseter motoneurons were active (shaded) and inactive (unshaded), respectively. The dotted guide line in B illustrates a hypothetical 1:1 correlation. Key for symbols is given in FigureA.
Fig. 9.
Fig. 9.
Examples from two rhythmically active interneurons (A, B) illustrating relationships between cortical stimulation pulses and neuronal action potentials. a, Motor and interneuron activities during three movement cycles.b, Framed sections in A andB at a shorter time scale. c, Post-stimulus histograms and corresponding circular representations of interneuronal firing during 20 cycles of fictive mastication. Stimulus frequency in A, 33 Hz; B, 40 Hz.
Fig. 10.
Fig. 10.
Examples of two different post-stimulus coupling patterns recorded in an interneuron during fictive mastication evoked by repetitive stimulation of LC-cx(A) and RC-cx(B). For additional details see Figure 9.
Fig. 11.
Fig. 11.
Histogram showing the number of interneurons activated with a time-locked, mixed, or random coupling of the spike to the preceding pulse in the cortical stimulus train. Seekey on figure.
Fig. 12.
Fig. 12.
Histogram showing latencies of time-locked cortically evoked excitation of Rpc-α and NVspo-γ interneurons during fictive mastication induced by repetitive stimulation of the left and right masticatory corteces. Binwidth, 1 msec. Seekey on figure.

References

    1. Appenteng K, Girdlestone D. Transneuronal transport of wheat-germ agglutinin-conjugated horseradish peroxidase into trigeminal interneurones of the cat. J Comp Neurol. 1987;258:387–393. - PubMed
    1. Appenteng K, Conyers L, Curtis J, Moore J. Monosynaptic connections of single V interneurones to the contralateral V motor nucleus in anaesthetized rats. Brain Res. 1990;514:128–130. - PubMed
    1. Batschelet E. Circular statistics in biology. Academic; New York: 1981.
    1. Berkowitz A, Stein PSG. Activity of descending propriospinal axons in the turtle hindlimb enlargement during two forms of fictive scratching: broad tuning to regions of the body surface. J Neurosci. 1994a;14:5089–5104. - PMC - PubMed
    1. Berkowitz A, Stein PSG. Activity of descending propriospinal axons in the turtle hindlimb enlargement during two forms of fictive scratching: phase analyses. J Neurosci. 1994b;14:5105–5119. - PMC - PubMed

Publication types

LinkOut - more resources