. 1998 Aug 15;18(16):6549-57.
doi: 10.1523/JNEUROSCI.18-16-06549.1998.

Neurofilament proteins in Y-cells of the cat lateral geniculate nucleus: normal expression and alteration with visual deprivation

Affiliations

Neurofilament proteins in Y-cells of the cat lateral geniculate nucleus: normal expression and alteration with visual deprivation

M E Bickford et al. J Neurosci. .

Abstract

We examined neurofilament staining in the normal and visually deprived lateral geniculate nucleus (LGN), using the SMI-32 antibody. This antibody preferentially stains LGN cells that display the morphological characteristics of Y-cells. The soma sizes of SMI-32-stained cells were consistent with those of the overall population of Y-cells, and the Golgi-like staining of their dendrites revealed a radial distribution that often crossed laminar boundaries. Labeled cells were distributed within the A laminae (primarily near laminar borders), the magnocellular portion of the C laminae, and the medial intralaminar nucleus, but they were absent in the parvocellular C laminae. Electron microscopic examination of SMI-32-stained tissue revealed that staining was confined to somata, dendrites, and large myelinated axons. Retinal synapses on SMI-32-labeled dendrites were primarily simple axodendritic contacts; few triadic arrangements were observed. In the LGN of cats reared with monocular lid suture, SMI-32 staining was decreased significantly in the A laminae that received input from the deprived eye. Dephosphorylation of the tissue did not alter the cellular SMI-32 staining patterns. Analysis of staining patterns in the C laminae and monocular zone of the A laminae suggests that changes in the cytoskeleton after lid suture reflect cell class and not binocular competition. Taken together, the results from normal and lid-sutured animals suggest that the cat LGN offers a unique model system in which the cytoskeleton of one class of cells can be manipulated by altering neuronal activity.


Figures

Fig. 1.
Fig. 1.
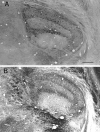
SMI-32-stained cells in the normal LGN match the distribution of Y-cells. Stained cells are located in laminaeA and A1, the magnocellular portion of the C laminae (C), and medial intralaminar nucleus (MIN), as shown in coronal (A) and sagittal (B) sections through the LGN. Higher magnification (C) shows that stained cells are located near laminar borders, and their radially distributed dendritic arbors cross laminar borders. Scale bars: in A (also applies toB), 1 mm; in C, 100 μm.
Fig. 2.
Fig. 2.
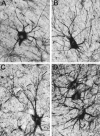
SMI-32-stained cells in the normal LGN display class I morphology. A, Cell in lamina A.B, Cell in lamina A1. C, Cell in lamina A1 extending dendrites into the interlaminar zone (border indicated by the dashed line). D, Cells in the medial intralaminar nucleus. Scale bar in A (also applies toB–D), 50 μm.
Fig. 3.
Fig. 3.
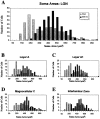
SMI-32-stained cells are the largest in the LGN. Histograms compare the distribution of soma areas of samples of Nissl- and SMI-32-stained cells in adjacent sections. A, Pooled data (400 Nissl- and 400 SMI-32-stained cells) from all laminae.B, The 100 Nissl- and 100 SMI-32-stained cells from lamina A. C, The 100 Nissl- and 100 SMI-32-stained cells from lamina A1. D, The 100 Nissl- and 100 SMI-32-stained cells from lamina C. E, The 100 Nissl- and 100 SMI-32-stained cells from the interlaminar zone between lamina A and A1.
Fig. 4.
Fig. 4.
The soma areas of SMI-32-labeled cells are consistent with the population of Y-like cells. Histograms show the pooled data from the A laminae of LGN (see Fig. 3B,C). Gaussian functions were fit to the data by a Simplex least-squares algorithm. The two gaussians derived from the Nissl data significantly differ from each other, but the gaussians fitting the SMI-32 data and the larger population of Nissl-labeled cells were not significantly different.
Fig. 5.
Fig. 5.
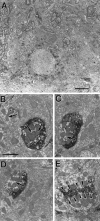
Ultrastructure of SMI-32 staining in the normal LGN. A, SMI-32 staining in cell somata is patchy and becomes more intense in dendrites. B–D, Simple axodendritic contacts (arrows) are made between retinal terminals and SMI-32-stained dendrites, although retinal terminals also may contact unlabeled dendritic terminals (asterisk inB). E, SMI-32 staining also is seen at puncta adherentia (arrowheads). Scale bars: inA, 5 μm; in B (also applies toC–E), 1 μm.
Fig. 6.
Fig. 6.
After MS, SMI-32 staining is reduced in the deprived A laminae. Shown are caudal (A,B) and rostral (C, D) sections through the LGN of a cat with right MS. In the left LGN (A, C), staining is reduced in lamina A. In the right LGN (B, D), staining is reduced in lamina A1. Scale bar in A (also applies toB–D), 1 mm.
Fig. 7.
Fig. 7.
SMI-32-stained cells in C laminae and the nondeprived A laminae of MS cats display class I morphology. Shown is a section through the left (A) and right (B) LGN of a cat with right MS. Scale bar inA (also applies to B), 100 μm.
Fig. 8.
Fig. 8.
Cells in both the deprived and nondeprived C laminae stain with the SMI-32 antibody. Shown are the left (A) and right (B) C laminae of a cat with right MS. The borders between the A1 and C lamina are indicated by lines. The arrows point to cells shown at higher magnification in C andD. Scale bars: in A (also applies toB), 100 μm; in C (also applies toD), 20 μm.
Fig. 9.
Fig. 9.
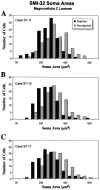
SMI-32-stained cells in the deprived lamina C are smaller than SMI-32-stained cells in the nondeprived lamina C. Histograms illustrate the soma size distributions of C lamina cells from three MS cats.
Fig. 10.
Fig. 10.
SMI-32 staining is reduced in both the binocular and monocular zones of the deprived A lamina. Shown are the Nissl-stained (A, B) and SMI-32-stained (C, D) sections through the left LGN of a cat with right MS. The border between the binocular and monocular zones is indicated by lines in A andC. Higher magnifications of the deprived monocular zone are shown in B and D. Monocular lamina A and C indicated. Scale bars: in A (also applies toC), 500 μm; in B (also applies toD), 100 μm.
Fig. 11.
Fig. 11.
Alkaline phosphatase treatment before SMI-32 staining does not alter the cellular staining pattern in the LGN. SMI-32 staining is reduced in the right LGN A1 lamina of a cat with right MS (A). Pretreatment of the tissue with alkaline phosphatase (B) increases axonal labeling, but cellular staining remains reduced in the deprived lamina A1. Scale bar in A (also applies to B), 1 mm.

References

    1. Adams JC. Heavy metal intensification of DAB-based HRP reaction product. J Histochem Cytochem. 1981;29:775. - PubMed
    1. Bickford ME, Van Horn SC, Sherman SM. Retinal Y axons contact interneurons in the lateral geniculate nucleus of the cat. Soc Neurosci Abstr. 1992;18:141.
    1. Campbell MJ, Morrison JH. Monoclonal antibody to neurofilament protein (SMI-32) labels a subpopulation of pyramidal neurons in the human and monkey cortex. J Comp Neurol. 1989;282:191–205. - PubMed
    1. Carmichael ST, Price JL. Architectonic subdivision of the orbital and prefrontal cortex in the macaque monkey. J Comp Neurol. 1994;346:366–402. - PubMed
    1. Chaudhuri A, Zangenehpour S, Matsubara JA, Cynader MS. Differential expression of neurofilament protein in the visual system of the vervet monkey. Brain Res. 1996;709:17–26. - PubMed

Publication types

Substances

LinkOut - more resources