Interleukin-1 induces slow-wave sleep at the prostaglandin D2-sensitive sleep-promoting zone in the rat brain
- PMID: 9698346
- PMCID: PMC6793214
- DOI: 10.1523/JNEUROSCI.18-16-06599.1998
Interleukin-1 induces slow-wave sleep at the prostaglandin D2-sensitive sleep-promoting zone in the rat brain
Abstract
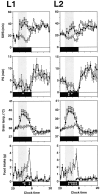
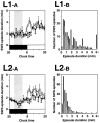
To determine the site of action of the sleep-promoting effect of interleukin-1 (IL-1), we continuously infused (between 11 P.M. and 5 A.M.) murine recombinant IL-1beta into seven different locations in the ventricular and subarachnoid systems of the brain in freely moving rats. When IL-1 was infused at 10 ng/6 hr into the subarachnoid space underlying the ventral surface of the rostral basal forebrain, which previously was defined as the "prostaglandin (PG) D2-sensitive sleep-promoting zone" (PGD2-SZ), the total amount of slow-wave sleep (SWS) increased by 110.7 min (IL-1 was 208.1 +/- 14.3 min vs control at 97.4 +/- 9.3 min; n = 8; p < 0.01 by paired Student's t test) from the baseline control level obtained under continuous infusion of saline vehicle. The hourly SWS during the infusion period reached the level of daytime SWS, the physiological maximum, whereas paradoxical sleep (PS) was decreased transiently. This site of action for the SWS promotion was dissociated from the site in the third ventricle sensitive to the IL-1-mediated PS suppression, fever, and anorexia. The SWS increase caused by IL-1 infusion into the PGD2-SZ was blocked completely by coadministered diclofenac, a nonselective cyclooxygenase (COX) inhibitor. Pretreatment of rats with NS-398 or piroxicam (3 mg/kg of body weight, i.p.), which are said, respectively, to possess high and relative specificity for the COX-2 enzyme, also blocked the SWS-promoting effect of IL-1. We present a hypothesis that IL-1 induces SWS, at least in part, via COX-2-mediated PG production in the PGD2-SZ.
Figures


Similar articles
-
Prostaglandin D2-sensitive, sleep-promoting zone defined in the ventral surface of the rostral basal forebrain.Proc Natl Acad Sci U S A. 1994 Dec 6;91(25):11998-2002. doi: 10.1073/pnas.91.25.11998. Proc Natl Acad Sci U S A. 1994. PMID: 7991572 Free PMC article.
-
Enhancement of slow-wave sleep by tumor necrosis factor-alpha is mediated by cyclooxygenase-2 in rats.Neuroreport. 1998 Dec 1;9(17):3791-6. doi: 10.1097/00001756-199812010-00005. Neuroreport. 1998. PMID: 9875706
-
Promotion of sleep mediated by the A2a-adenosine receptor and possible involvement of this receptor in the sleep induced by prostaglandin D2 in rats.Proc Natl Acad Sci U S A. 1996 Jun 11;93(12):5980-4. doi: 10.1073/pnas.93.12.5980. Proc Natl Acad Sci U S A. 1996. PMID: 8650205 Free PMC article.
-
[Regulation of SWS by hormones and cytokines].Sheng Li Ke Xue Jin Zhan. 2000 Jan;31(1):30-4. Sheng Li Ke Xue Jin Zhan. 2000. PMID: 12532764 Review. Chinese.
-
Prostaglandin D2 and sleep--a molecular genetic approach.J Sleep Res. 1999 Jun;8 Suppl 1:60-4. doi: 10.1046/j.1365-2869.1999.00010.x. J Sleep Res. 1999. PMID: 10389108 Review.
Cited by
-
Sleep, Narcolepsy, and Sodium Oxybate.Curr Neuropharmacol. 2022;20(2):272-291. doi: 10.2174/1570159X19666210407151227. Curr Neuropharmacol. 2022. PMID: 33827411 Free PMC article.
-
SLEEP AND CYTOKINES.Sleep Med Clin. 2007;2(2):161-169. doi: 10.1016/j.jsmc.2007.03.003. Sleep Med Clin. 2007. PMID: 19098992 Free PMC article. No abstract available.
-
Role of the L-PGDS-PGD2-DP1 receptor axis in sleep regulation and neurologic outcomes.Sleep. 2019 Jun 11;42(6):zsz073. doi: 10.1093/sleep/zsz073. Sleep. 2019. PMID: 30893431 Free PMC article. Review.
-
Neuromodulatory role of endogenous interleukin-1β in acute seizures: possible contribution of cyclooxygenase-2.Neurobiol Dis. 2012 Jan;45(1):234-42. doi: 10.1016/j.nbd.2011.08.007. Epub 2011 Aug 10. Neurobiol Dis. 2012. PMID: 21856425 Free PMC article.
-
Prostaglandin D2 Receptor DP1 Antibodies Predict Vaccine-induced and Spontaneous Narcolepsy Type 1: Large-scale Study of Antibody Profiling.EBioMedicine. 2018 Mar;29:47-59. doi: 10.1016/j.ebiom.2018.01.043. Epub 2018 Feb 2. EBioMedicine. 2018. PMID: 29449194 Free PMC article.
References
-
- Borbély AA, Tobler I. Endogenous sleep-promoting substances and sleep regulation. Physiol Rev. 1989;69:605–670. - PubMed
-
- Cao C, Matsumura K, Yamagata K, Watanabe Y. Endothelial cells of the rat brain vasculature express cyclooxygenase-2 mRNA in response to systemic interleukin-1β: a possible site of prostaglandin synthesis responsible for fever. Brain Res. 1996;733:263–272. - PubMed
-
- Dinarello CA, Marnoy SO, Rosenwasser LJ. Role of arachidonate metabolism in the immunoregulatory function of human leukocytic pyrogen/lymphocyte activating factor/interleukin-1. J Immunol. 1983;130:890–895. - PubMed
-
- Engelhardt G, Bögel R, Schnitzler C, Utzmann R. Meloxicam: influence on arachidonic acid metabolism. Part II. In vivo findings. Biochem Pharmacol. 1996;51:29–38. - PubMed
Publication types
MeSH terms
Substances
LinkOut - more resources
Full Text Sources
Other Literature Sources
Research Materials
Miscellaneous
