. 1998 Aug 10;142(3):815-25.
doi: 10.1083/jcb.142.3.815.

Overexpression of a neural-specific rho family GTPase, cRac1B, selectively induces enhanced neuritogenesis and neurite branching in primary neurons

Affiliations

Overexpression of a neural-specific rho family GTPase, cRac1B, selectively induces enhanced neuritogenesis and neurite branching in primary neurons

C Albertinazzi et al. J Cell Biol. .

Abstract

Rho family GTPases have been implicated in cytoskeletal reorganization during neuritogenesis. We have recently identified a new gene of this family, cRac1B, specifically expressed in the chicken developing nervous system. This GTPase was overexpressed in primary neurons to study the role of cRac1B in the development of the neuronal phenotype. Overexpression of cRac1B induced an increment in the number of neurites per neuron, and dramatically increased neurite branching, whereas overexpression of the highly related and ubiquitous cRac1A GTPase did not evidently affect neuronal morphology. Furthermore, expression of an inactive form of cRac1B strikingly inhibited neurite formation. The specificity of cRac1B action observed in neurons was not observed in fibroblasts, where both GTPases produced similar effects on cell morphology and actin organization, indicating the existence of a cell type-dependent specificity of cRac1B function. Molecular dissection of cRac1B function by analysis of the effects of chimeric cRac1A/cRac1B proteins showed that the COOH-terminal portion of cRac1B is essential to induce increased neuritogenesis and neurite branching. Considering the distinctive regulation of cRac1B expression during neural development, our data strongly support an important role of cRac1B during neuritogenesis, and they uncover new mechanisms underlying the functional specificity of distinct Rho family GTPases.


Figures
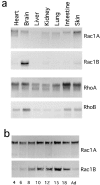
Figure 1
Figure 1
Northern blot analysis of GTPase mRNA levels in different organs from E10 chick embryos (a) and during brain development (b). Equal amounts of RNA extracted from different organs from E10 chick embryos (a), or from E4, E6, E8, E10, E12, E15, E18, and adult (Ad) chicken (b) were electrophoresed on 1% agarose gels and transferred to filters as described in Materials and Methods. Filters were incubated with 32P-labeled probes specific for the different GTPases, as indicated on the right of the blots. In a, filters for the cRac1A and cRac1B transcripts were exposed for autoradiography for 6 and 48 h, respectively. In b, the filter was first incubated for the detection of the cRac1A transcript (7 h exposure), and then stripped and used for the detection of the cRac1B transcript (6 h exposure).
Figure 2
Figure 2
Specificity of the anti-cRac1B polyclonal antibody. 1.5-μg aliquots of the fusion proteins GST-cRhoA (lane 1), GST-cRhoB (lane 2), GST-cRac1A (lane 3), and GST-cRac1B (lane 4), obtained as described in the Materials and Methods, were electrophoresed and transferred to nitrocellulose filters. The filters were analyzed by Western blot with the anti-cRac1B polyclonal antibody.
Figure 3
Figure 3
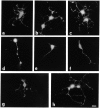
Effects of the expression of cRac1A and cRac1B GTPases on neuronal morphology. Retinal neurons cultured overnight on polylysine- and laminin-coated coverslips were transfected with pFLAG-LacZ (a and d), pFLAG-cRac1B (b, c, e, and f), or pFLAG-cRac1A (g–i). After 1 d more in culture, cells were processed for immunofluorescence using the anti–β-galactosidase mAb (a), the anti–Flag-M5 mAb (b, f, g, and i), the anti-cRac1B polyclonal antibody (c), and the polyclonal antibody against the 200-kD neurofilament protein (d, e, and h). The same cells are shown in a and d; in b and e; and in g and h. Bar, 10 μm.
Figure 10
Figure 10
Effects of the expression of chimeric cRac1A/cRac1B GTPases on neuronal morphology. Retinal neurons cultured overnight on polylysine- and laminin-coated coverslips were transfected with pFLAG-cRac1B (a), pFLAG-cRac1-ABB (b), pFLAG-cRac1-BAB (c), pFLAG-cRac1A (d), pFLAG-cRac1-BAA (e), pFLAG-cRac1-BBA (f), and pFLAG-cRac1- AAB (g and h). After 1 d more in culture, cells were processed for immunofluorescence using the anti–Flag-M5 mAb. Neurons were identified by double staining with an anti-neurofilament antibody (not shown). Bar, 10 μm.
Figure 4
Figure 4
Effect of the expression of N17-cRac1B on neuronal morphology. Retinal neurons cultured overnight on polylysine- and laminin-coated coverslips were transfected with pFLAG-cRac1B (a and b), or pFLAG-N17-cRac1B (c–g). After 20 h in culture, cells were processed for immunofluorescence using the anti–Flag-M5 mAb. Bar, 10 μm.
Figure 5
Figure 5
Quantitative analysis of the effects of the overexpression of the N17-cRac1A and N17-cRac1B proteins on neuritogenesis. Cultures of retinal neurons transfected as described in Fig. 4 were used for the quantitation of the effects of the expression of the dominant-negative forms of the cRac1A and cRac1B GTPases on neuritogenesis, as described in the Materials and Methods. (a) Percentage of neurons with one or two poorly branched neurites (more than three cell diameters in length); (b) neurons with no or short neurites (less than three cell diameters in length); (c) neurons with morphologies different from a and b (i.e., with more than two neurites and/or limited branching). Results are expressed as the mean percentage of cells (± SE) from four separate experiments. In a and b, the differences between N17-cRac1A (white bars) and N17-cRac1B (gray bars) are significant (P < 0.001).
Figure 6
Figure 6
N17-cRac1B expression does not affect cell viability. Retinal neurons cultured overnight on polylysine- and laminin-coated coverslips were transfected with pFLAG-N17-cRac1B. After 18 h, cells were incubated with propidium iodide as described in the Materials and Methods, fixed, and then treated for immunofluorescence using the anti–Flag-M5 mAb. The same field is shown in a–c and in d–f. (a and d) Transfected neurons detected with the anti–Flag-M5 mAb; (b and e) propidium iodide staining; (c and f) phase contrast. Arrowheads show the position of the transfected neurons. Arrows in b and c, and in e and f point to propidium iodide–positive, non-transfected cells. Bar, 10 μm.
Figure 7
Figure 7
Analysis of the effect of the expression of wild-type and constitutively active cRac1B on neuritogenesis. Cultures of retinal neurons transfected with either pFLAG-cRac1B (1B-wt, white bar) or pFLAG-V12-cRac1B (1B-V12, gray bar) were used for the quantitation of the effects of the expression of the wild-type and constitutively active cRac1B GTPases on neuritogenesis, as described in the Materials and Methods. Columns represent the average number of neurites/neuron (±SE). The difference observed between cRac1B-wt and cRac1B-V12 is significant (P < 0.001).
Figure 8
Figure 8
Effects of the expression of Rho GTPases on CEF morphology. CEFs cultured overnight on glass coverslips were transfected with pFLAG-LacZ (a and b), pFLAG-cRhoB (c and d), pFLAG-cRac1B (e–h), or pFLAG-cRac1A (i) plasmid. After 8 h (c and d), 11 h (e and f), or 1 d in culture (a, b, g–i), cells were processed for immunofluorescence. First antibodies used were: mAb against β-galactosidase (a), mAb anti-Flag-M5 (c, e, g, and i); in b, d, f, h, cells were stained with fluoresceinated phalloidin. The same cells are shown in a and b; in c and d; in e and f; and in g and h. Bar, 10 μm.
Figure 9
Figure 9
Schematic diagram of the wild-type cRac1A and cRac1B polypeptides (A), of the cRac1A/cRac1B chimeric proteins expressed in retinal neurons (B), and comparison between the COOH-terminal portions of cRac1A and cRac1B (C). In A, the three regions containing all 12 amino acid differences between the cRac1A and cRac1B polypeptides are indicated. The numbers under the areas indicated as IR (Rho's insert region), E (a region required for the interaction with some of the known Rac effectors), and M (the COOH-terminal region known to be involved in membrane targeting) indicate the differences in amino acid residues between the two GTPases. EL, the classical effector loop. In B are shown the five chimeric constructs obtained by changing one or two of the IR, E, and M regions between cRac1A and cRac1B. See the Materials and Methods for details on the preparation of these constructs. In C, the amino acid sequences of the COOH-terminal portion of cRac1A and cRac1B are compared. The black dots indicate amino acid differences between the two GTPases.
Figure 11
Figure 11
Analysis of the effect of the expression of wild-type and chimeric GTPases on neuritogenesis. Cultures of retinal neurons were transfected with pFLAG-cRac1B (1B-wt), pFLAG-cRac1-ABB (ABB), pFLAG-cRac1-BAB (BAB), pFLAG-cRac1-AAB (AAB), pFLAG-cRac1A (1A-wt), pFLAG-cRac1-BBA (BBA), or pFLAG-cRac1-BAA (BAA). After 1 d, cultures were used to quantify the effects of the expression of the different constructs on neurite extension, as described in the Materials and Methods. Columns represent the average number of neurites/neuron (±SE). The value obtained for each of the constructs containing the COOH-terminal M segment (see Fig. 8) from cRac1B (gray columns to the left) is significantly different from each of the values obtained from transfected neurons expressing any of the constructs with the COOH-terminal M segment from cRac1A (white columns to the right) (P < 0.001).

References

    1. Acheson DWK, Kemplay SK, Webster KE. Quantitative analysis of optic terminal profile distribution within the pigeon optic tectum. Neuroscience. 1980;5:1067–1084. - PubMed
    1. Belloc F, Dumain P, Boisseau MR, Jalloustre C, Reiffers J, Bernard P, Lacombe F. A flow cytometric method using Hoechst 33342 and propidium iodide for simultaneous cell cycle analysis and apoptosis determination in unfixed cells. Cytometry. 1994;17:59–65. - PubMed
    1. Boussif O, Lezoualc'h F, Zanta MA, Mergny MD, Scherman D, Demeneix B, Behr JP. A versatile vector for gene and oligonucleotide transfer into cells in culture and in vivo: polyethylenimine. Proc Natl Acad Sci USA. 1995;92:7297–7301. - PMC - PubMed
    1. Cattelino A, Longhi R, de Curtis I. Differential distribution of two cytoplasmic variants of the α6β1 integrin laminin receptor in the ventral plasma membrane of embryonic fibroblasts. J Cell Sci. 1995;108:3067–3078. - PubMed
    1. Chomczynski P, Sacchi N. Single-step method of RNA isolation by acid guanidinium thiocyanate-phenol-chloroform extraction. Anal Biochem. 1987;162:156–159. - PubMed

Publication types

MeSH terms

Grants and funding