. 1998 Aug 17;188(4):699-713.
doi: 10.1084/jem.188.4.699.

Induction of early B cell factor (EBF) and multiple B lineage genes by the basic helix-loop-helix transcription factor E12

Affiliations

Induction of early B cell factor (EBF) and multiple B lineage genes by the basic helix-loop-helix transcription factor E12

B L Kee et al. J Exp Med. .

Abstract

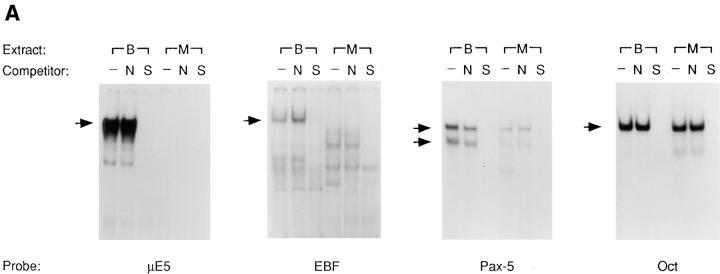
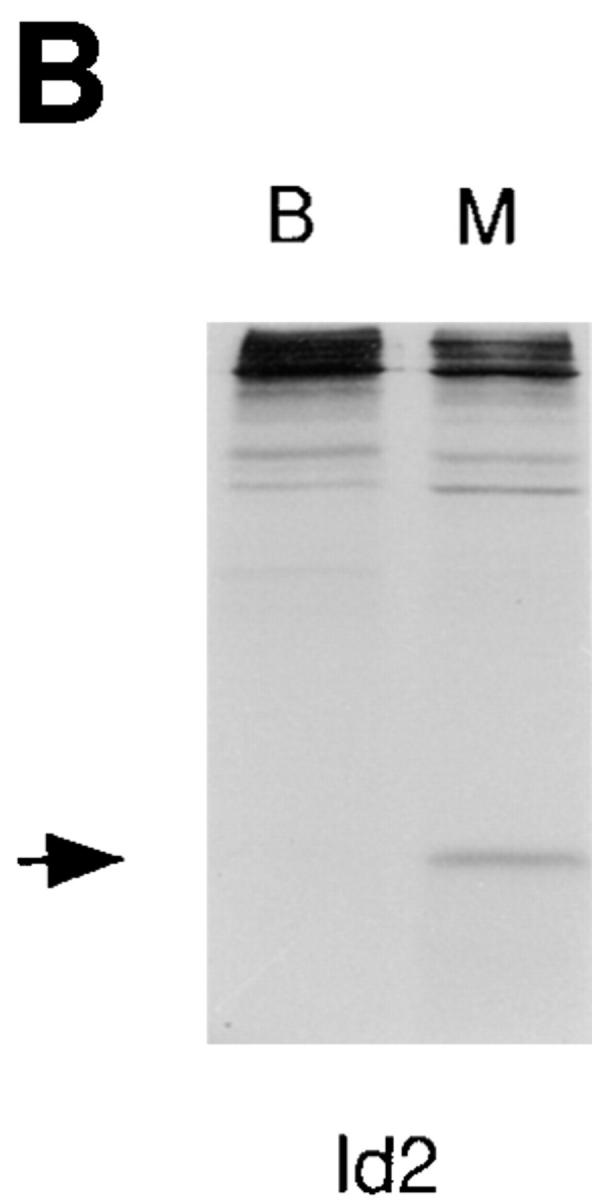
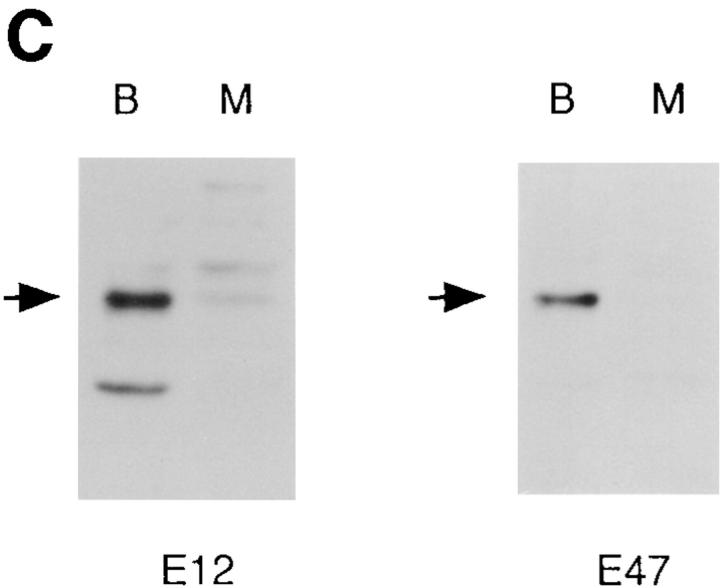
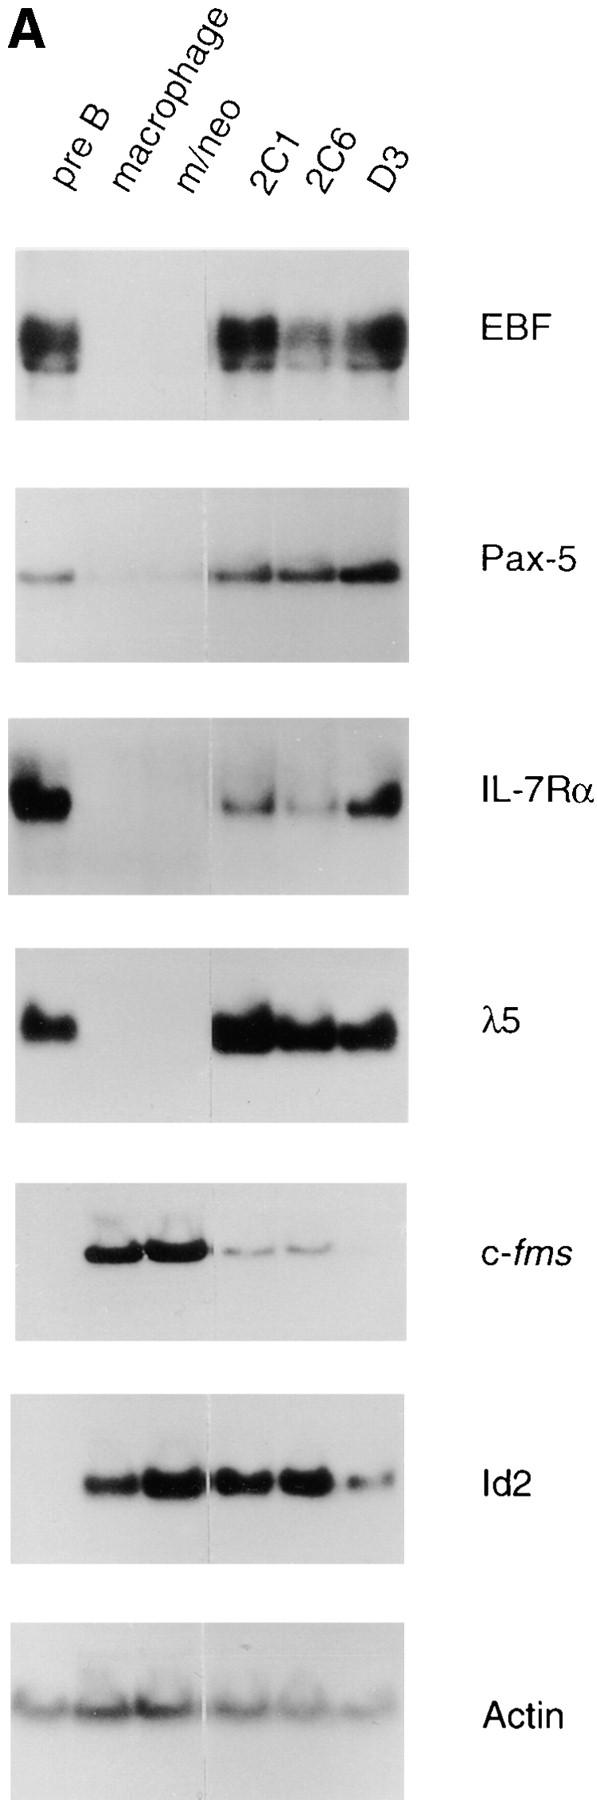
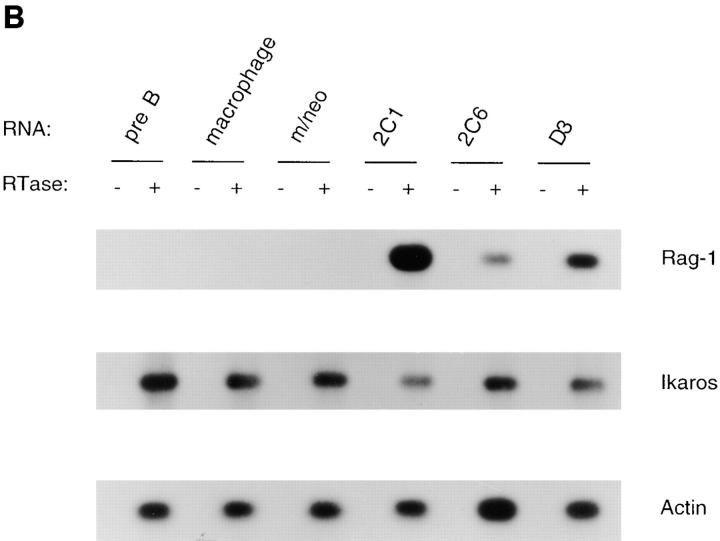
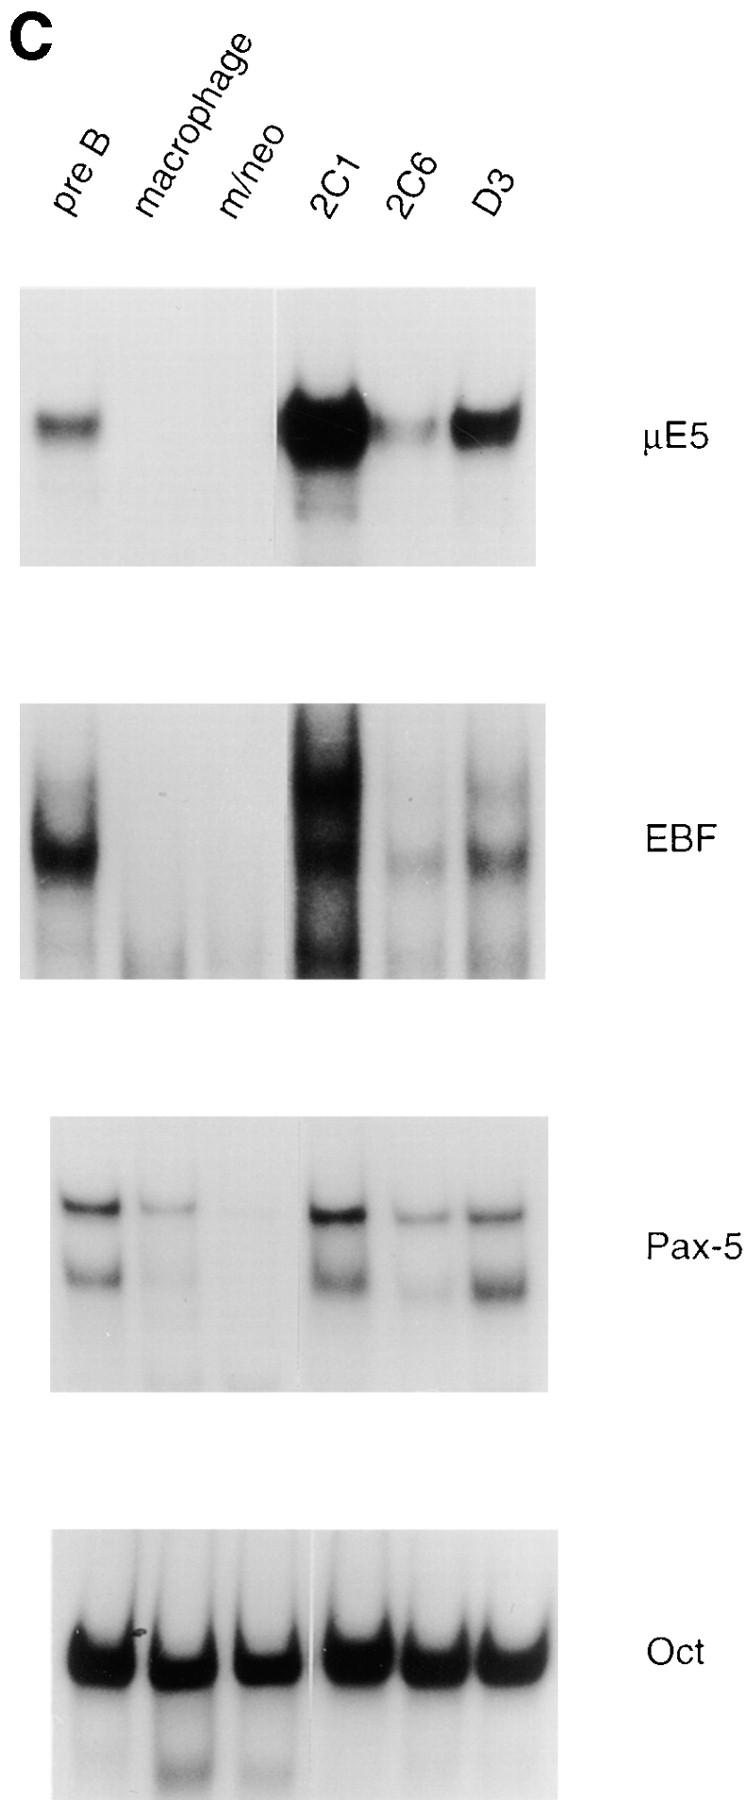
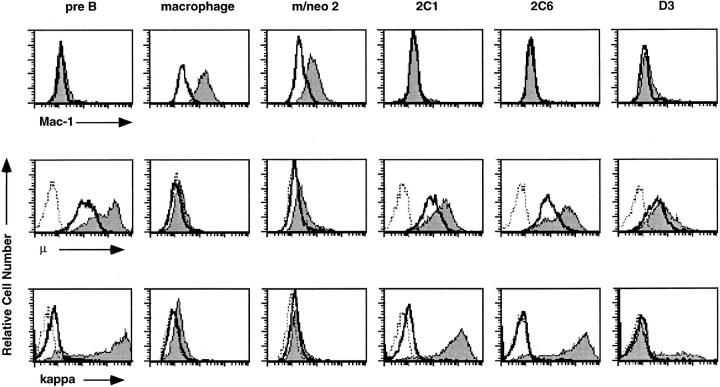
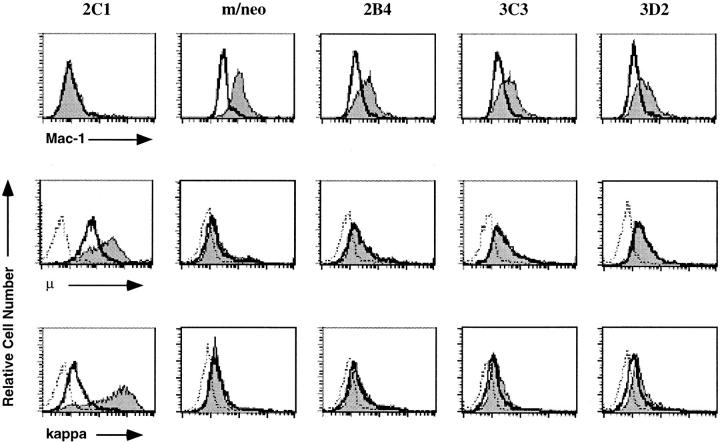
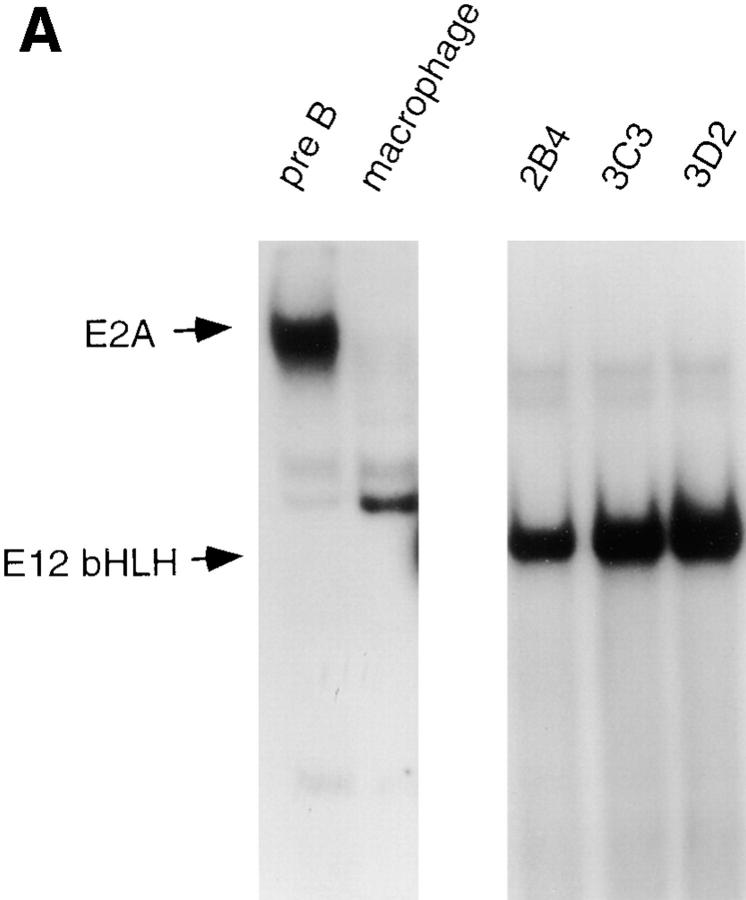
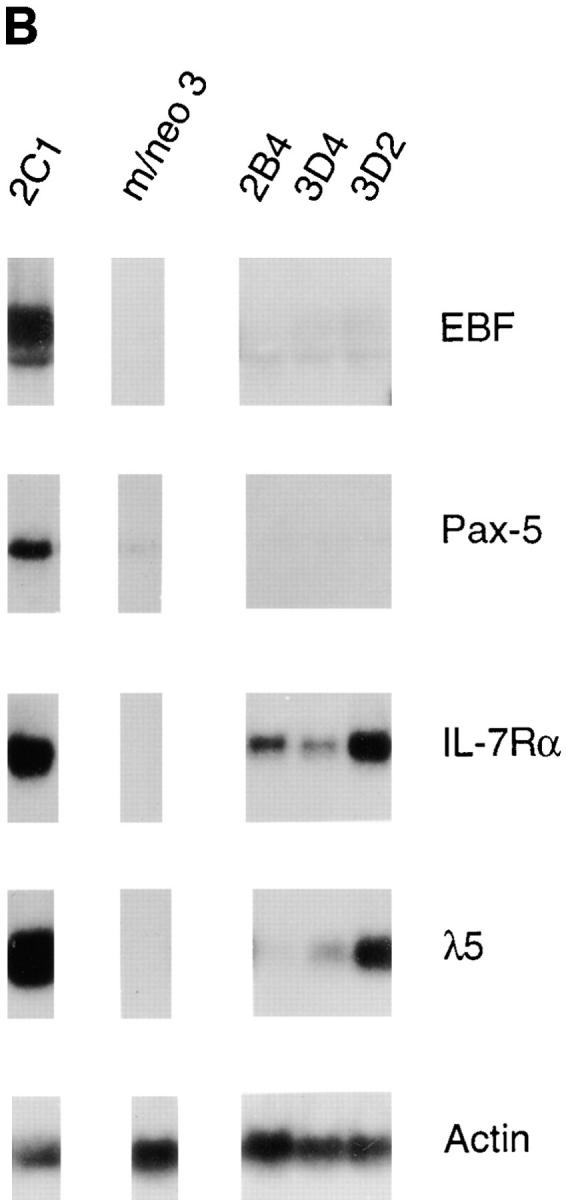
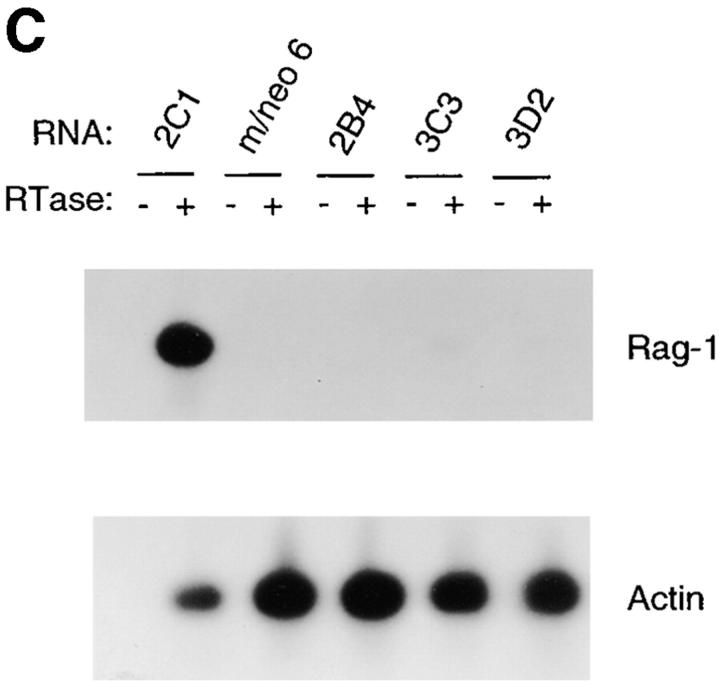
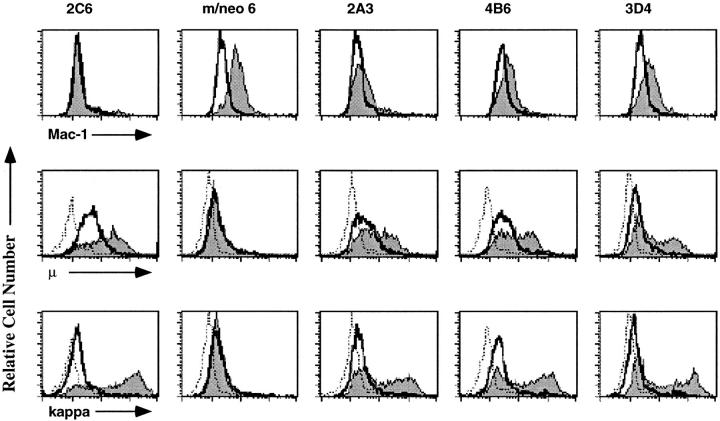
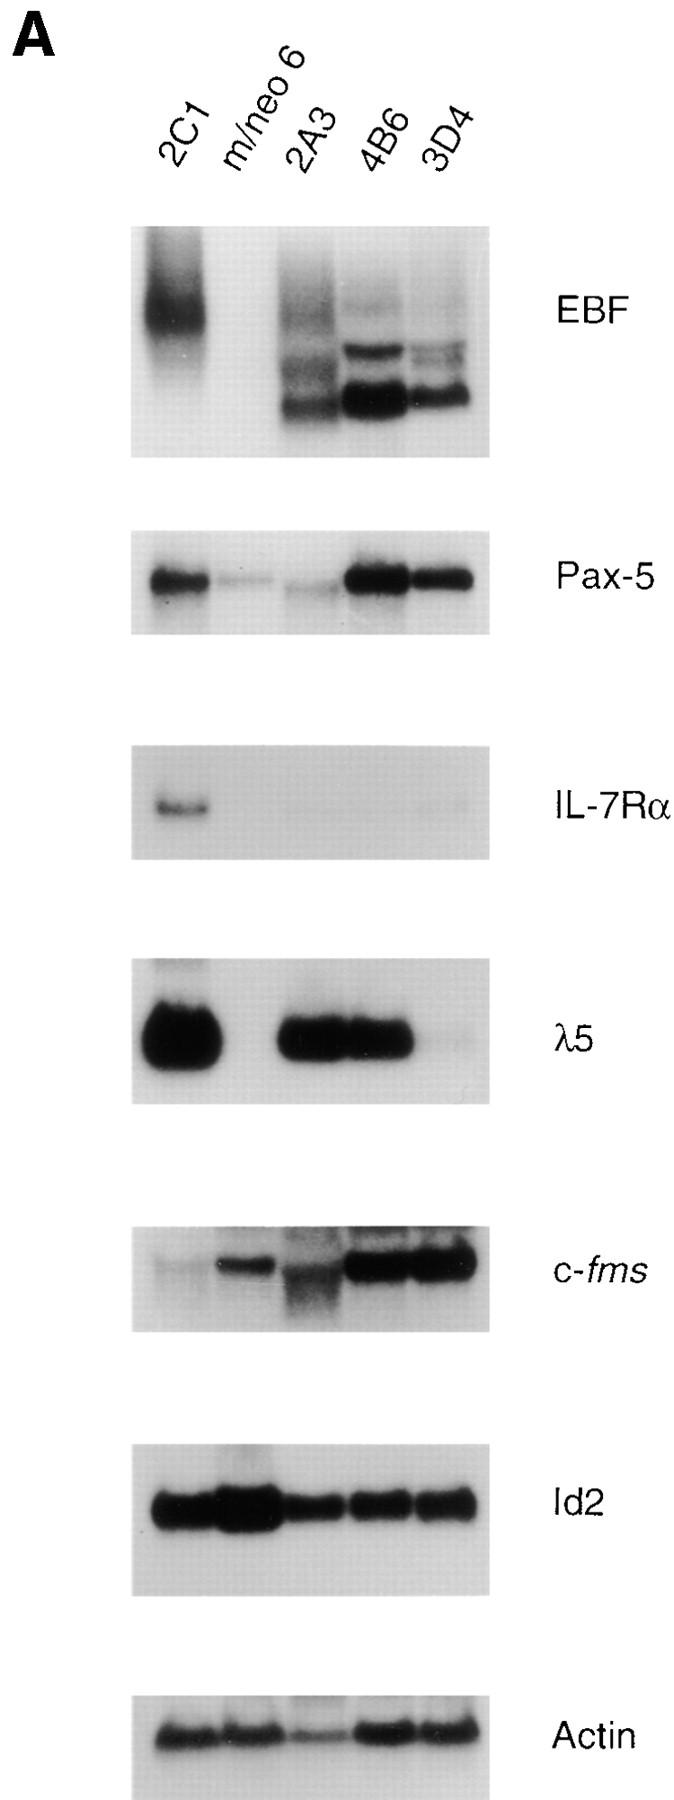
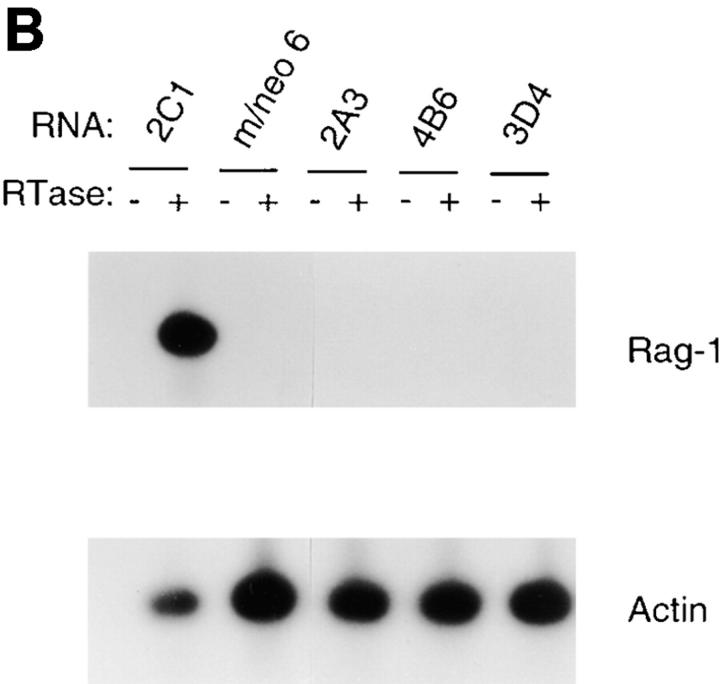
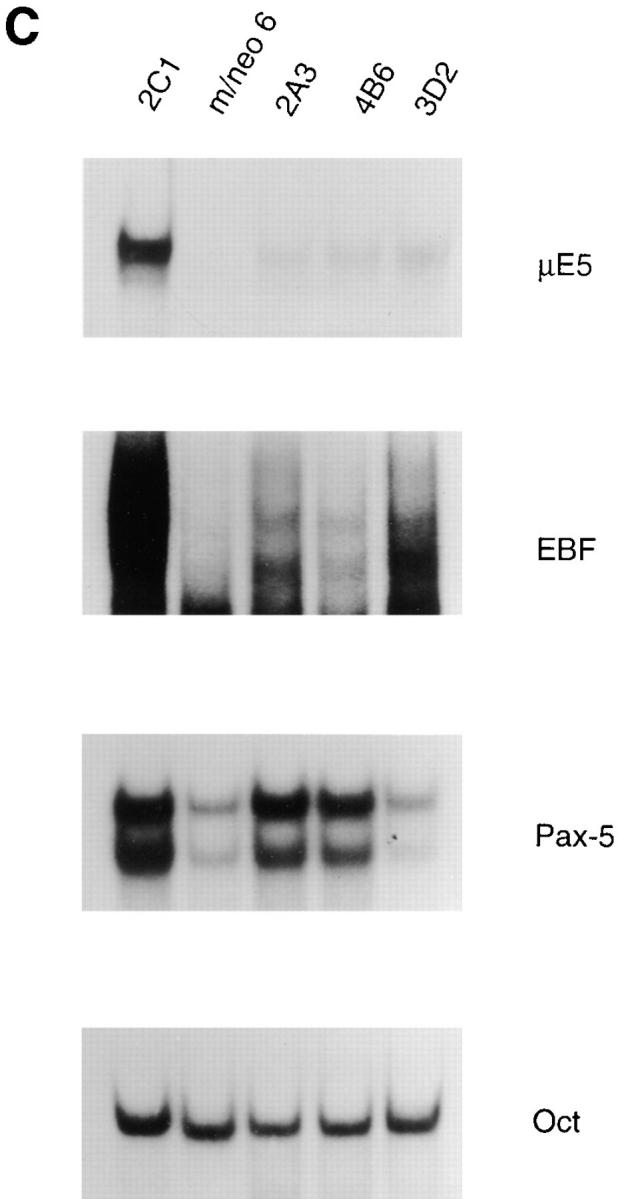
The transcription factors encoded by the E2A and early B cell factor (EBF) genes are required for the proper development of B lymphocytes. However, the absence of B lineage cells in E2A- and EBF-deficient mice has made it difficult to determine the function or relationship between these proteins. We report the identification of a novel model system in which the role of E2A and EBF in the regulation of multiple B lineage traits can be studied. We found that the conversion of 70Z/3 pre-B lymphocytes to cells with a macrophage-like phenotype is associated with the loss of E2A and EBF. Moreover, we show that ectopic expression of the E2A protein E12 in this macrophage line results in the induction of many B lineage genes, including EBF, IL7Ralpha, lambda5, and Rag-1, and the ability to induce kappa light chain in response to mitogen. Activation of EBF may be one of the critical functions of E12 in regulating the B lineage phenotype since expression of EBF alone leads to the activation of a subset of E12-inducible traits. Our data demonstrate that, in the context of this macrophage line, E12 induces expression of EBF and together these transcription factors coordinately regulate numerous B lineage-associated genes.


Figures

Figure 1
Figure 1
A reduction in E2A, EBF and Pax-5 DNA binding activity is associated with the transition of 70Z/3 pre-B cells to the macrophage phenotype. (A) Electrophoretic mobility shift analysis of nuclear extracts prepared from the 70Z/3 pre-B (B) and macrophage (M) cell lines. 10 μg of nuclear extract was incubated with a 32P-labeled oligonucleotide probe containing an E2A- (μE5), EBF-, Pax-5–, or Oct-binding site. The extracts were incubated in the absence (−) or presence of a 100-fold excess of specific (S) or nonspecific (N) competitive oligo. Arrows indicate the specific DNA-binding complexes corresponding to E2A, EBF, Pax-5, or Oct-1. Two complexes are expected with Pax-5 oligo that contains both a Pax-5– and ets-binding site (52). (B) Immunoprecipitation of Id2 from 35S-methionine–labeled 70Z/3 pre-B (B) and macrophage (M) cell lines. (C) Western blot analysis of 70Z/3 pre-B (B) and macrophage (M) nuclear extracts. E2A proteins were detected with an anti-E12 (mAb 382.1) or anti-E47 (mAb 32.1) monoclonal antibody.
Figure 1
Figure 1
A reduction in E2A, EBF and Pax-5 DNA binding activity is associated with the transition of 70Z/3 pre-B cells to the macrophage phenotype. (A) Electrophoretic mobility shift analysis of nuclear extracts prepared from the 70Z/3 pre-B (B) and macrophage (M) cell lines. 10 μg of nuclear extract was incubated with a 32P-labeled oligonucleotide probe containing an E2A- (μE5), EBF-, Pax-5–, or Oct-binding site. The extracts were incubated in the absence (−) or presence of a 100-fold excess of specific (S) or nonspecific (N) competitive oligo. Arrows indicate the specific DNA-binding complexes corresponding to E2A, EBF, Pax-5, or Oct-1. Two complexes are expected with Pax-5 oligo that contains both a Pax-5– and ets-binding site (52). (B) Immunoprecipitation of Id2 from 35S-methionine–labeled 70Z/3 pre-B (B) and macrophage (M) cell lines. (C) Western blot analysis of 70Z/3 pre-B (B) and macrophage (M) nuclear extracts. E2A proteins were detected with an anti-E12 (mAb 382.1) or anti-E47 (mAb 32.1) monoclonal antibody.
Figure 3
Figure 3
Increased expression of B lineage–associated genes in E12- expressing macrophages. (A) Northern blot analysis of EBF, Pax-5, IL7Rα, λ5, c-fms, Id2, and actin mRNA expression. 10 μg of total RNA extracted from the 70Z/3 pre-B, macrophage, m/neo, and the E12-expressing macrophage clones 2C1, 2C6, and D3 was electrophoresed through an 0.8% agarose gel and transferred to nylon membrane. The blots were probed sequentially with 32P-labeled cDNA probes for the indicated genes. (B) RT-PCR analysis of Rag-1 and Ikaros RNA expression. 2 μg of total RNA was reverse transcribed using an oligo dT15 primer in the presence (+) or absence (−) of RT. 100 ng of cDNA was used for PCR amplification with primers specific for Rag-1 (25 cycles), the COOH-terminal domain of Ikaros (25 cycles), or actin (13 cycles; C) μE5, EBF, Pax-5, and Oct DNA binding activity in E12-expressing macrophage cell lines. 10 μg of nuclear extract from each of the indicated cell lines was incubated with a 32P-labeled oligonucleotide probe containing the binding site for E2A (μE5), EBF, Pax-5, and Oct.
Figure 3
Figure 3
Increased expression of B lineage–associated genes in E12- expressing macrophages. (A) Northern blot analysis of EBF, Pax-5, IL7Rα, λ5, c-fms, Id2, and actin mRNA expression. 10 μg of total RNA extracted from the 70Z/3 pre-B, macrophage, m/neo, and the E12-expressing macrophage clones 2C1, 2C6, and D3 was electrophoresed through an 0.8% agarose gel and transferred to nylon membrane. The blots were probed sequentially with 32P-labeled cDNA probes for the indicated genes. (B) RT-PCR analysis of Rag-1 and Ikaros RNA expression. 2 μg of total RNA was reverse transcribed using an oligo dT15 primer in the presence (+) or absence (−) of RT. 100 ng of cDNA was used for PCR amplification with primers specific for Rag-1 (25 cycles), the COOH-terminal domain of Ikaros (25 cycles), or actin (13 cycles; C) μE5, EBF, Pax-5, and Oct DNA binding activity in E12-expressing macrophage cell lines. 10 μg of nuclear extract from each of the indicated cell lines was incubated with a 32P-labeled oligonucleotide probe containing the binding site for E2A (μE5), EBF, Pax-5, and Oct.
Figure 2
Figure 2
E12-expressing macrophage clones cease to express Mac-1 and respond to LPS by induction of κ light chain and μ. The 70Z/3 pre-B, macrophage, m/neo, and the E12-expressing macrophage cell lines, 2C1, 2C6, and D3 were examined by flow cytometry for the expression of the myeloid associated marker Mac-1 (top). The shaded histogram represents specific Mac-1 staining; open histograms represent staining in the presence of a nonspecific control antibody. Flow cytometric analysis of μ (middle) or κ (bottom) expression on the indicated cell lines after incubation for 36 h in the presence (shaded histogram) or absence (open histogram) of LPS. The histogram outlined with a dashed line represents staining in the presence of an isotype control antibody.
Figure 4
Figure 4
E12 bHLH-expressing macrophage clones express Mac-1 but fail to respond to LPS by induction of κ light chain and μ. The E12-expressing 2C1 line, m/neo, and three E12 bHLH-expressing macrophage lines 2B4, 3C3, and 3D2 were examined by flow cytometry for the expression of the myeloid associated marker Mac-1 (top). The shaded histogram represents specific Mac-1 staining, open histograms represent staining in the presence of a nonspecific control antibody. Flow cytometric analysis of μ (middle) or κ (bottom) expression on the indicated cell lines after incubation in the presence (shaded histogram) or absence (open histogram) of LPS for 36 h. The histogram outlined with a dashed line represents staining in the presence of an isotype control antibody.
Figure 5
Figure 5
The transactivation domains of E12 are required for activation of most B lineage genes. (A) EMSA of μE5-binding complexes in 70Z/3 pre-B, macrophage and three E12 bHLH-expressing macrophage clones 2B4, 3C3 and 3D2 (which lack the transactivation domains). All lanes are from the same gel, however the pre-B and macrophage panel was exposed for threefold longer than the 2B4, 3C3 and 3D2 lanes. The position of the full-length E2A and E12 bHLH-binding complexes are indicated with an arrow on the left side of the figure. (B) Northern blot analysis of EBF, Pax-5, IL7Rα, λ5, and actin expression in E12 bHLH-expressing macrophage clones. 10 μg of total RNA from each of the cell lines was electrophoresed through an 0.8% agarose gel and transferred to nylon membrane. For comparison an E12-expressing (2C1) and neomycin expressing (m/neo3) macrophage clone run on the same gel, are shown. The blots were probed sequentially with 32P-labeled cDNA probes for the indicated genes. The blot was probed with actin to demonstrate that similar amounts of RNA were loaded in each lane. (C) RT-PCR analysis of Rag-1 and actin RNA expression in the E12 bHLH-expressing macrophage clones. 2 μg of total RNA was reverse-transcribed using an oligo dT15 primer in the presence (+) or absence (−) of RT. 100 ng of cDNA was used for PCR amplification with primers specific for Rag-1 (25 cycles) or actin (13 cycles).
Figure 5
Figure 5
The transactivation domains of E12 are required for activation of most B lineage genes. (A) EMSA of μE5-binding complexes in 70Z/3 pre-B, macrophage and three E12 bHLH-expressing macrophage clones 2B4, 3C3 and 3D2 (which lack the transactivation domains). All lanes are from the same gel, however the pre-B and macrophage panel was exposed for threefold longer than the 2B4, 3C3 and 3D2 lanes. The position of the full-length E2A and E12 bHLH-binding complexes are indicated with an arrow on the left side of the figure. (B) Northern blot analysis of EBF, Pax-5, IL7Rα, λ5, and actin expression in E12 bHLH-expressing macrophage clones. 10 μg of total RNA from each of the cell lines was electrophoresed through an 0.8% agarose gel and transferred to nylon membrane. For comparison an E12-expressing (2C1) and neomycin expressing (m/neo3) macrophage clone run on the same gel, are shown. The blots were probed sequentially with 32P-labeled cDNA probes for the indicated genes. The blot was probed with actin to demonstrate that similar amounts of RNA were loaded in each lane. (C) RT-PCR analysis of Rag-1 and actin RNA expression in the E12 bHLH-expressing macrophage clones. 2 μg of total RNA was reverse-transcribed using an oligo dT15 primer in the presence (+) or absence (−) of RT. 100 ng of cDNA was used for PCR amplification with primers specific for Rag-1 (25 cycles) or actin (13 cycles).
Figure 6
Figure 6
EBF-expressing macrophage lines express Mac-1 and respond to LPS by induction of κ light chain and μ. The 2C6, m/neo 6 (a neomycin-expressing macrophage), and 3 EBF-expressing macrophage cell lines, 2A3, 4B6, and 3D4 were examined by flow cytometry for the expression of the myeloid-associated marker Mac-1 (top). The shaded histogram represents specific Mac-1 staining, open histograms represent staining in the presence of a nonspecific control antibody. Flow cytometric analysis of μ (middle) or κ (bottom) expression on the indicated cell lines after incubation for 36 h in the presence (shaded histogram) or absence (open histogram) of LPS. The histogram outlined with a dashed line represents staining in the presence of an isotype control antibody. The 70Z/3 pre-B, macrophage, m/neo, and the E12-expressing macrophage cell lines, 2C1, 2C6, and D3 were examined by flow cytometry for the expression of the myeloid associated marker Mac-1 (top).
Figure 7
Figure 7
Expression of a subset of B lineage genes in EBF-expressing macrophage cell lines. (A) Northern blot analysis of EBF, Pax-5, IL7Rα, λ5, c-fms, Id2, and actin mRNA expression. 10 μg of total RNA extracted from the EBF-expressing macrophage cell lines 2A3, 4B6, and 3D4 or from a neomycin- or E12-expressing macrophage clone 2C1 was electrophoresed through an 0.8% agarose gel and transferred to nylon membrane. The blots were probed sequentially with 32P-labeled cDNA probes for the indicated genes. (B) RT-PCR analysis of Rag-1 and actin RNA expression. 2 μg of total RNA was reverse-transcribed using an oligo dT15 primer in the presence (+) or absence (−) of RT. 100 ng of cDNA was used for PCR amplification with primers specific for Rag-1 (25 cycles), or actin (13 cycles). (C) μE5, EBF, Pax-5, and Oct DNA binding activity in EBF- expressing macrophage cell lines. 10 μg of nuclear extract from each of the indicated cell lines was incubated with a 32P-labeled oligonucleotide probe containing the binding site for E2A (μE5), EBF, Pax-5, and Oct.
Figure 7
Figure 7
Expression of a subset of B lineage genes in EBF-expressing macrophage cell lines. (A) Northern blot analysis of EBF, Pax-5, IL7Rα, λ5, c-fms, Id2, and actin mRNA expression. 10 μg of total RNA extracted from the EBF-expressing macrophage cell lines 2A3, 4B6, and 3D4 or from a neomycin- or E12-expressing macrophage clone 2C1 was electrophoresed through an 0.8% agarose gel and transferred to nylon membrane. The blots were probed sequentially with 32P-labeled cDNA probes for the indicated genes. (B) RT-PCR analysis of Rag-1 and actin RNA expression. 2 μg of total RNA was reverse-transcribed using an oligo dT15 primer in the presence (+) or absence (−) of RT. 100 ng of cDNA was used for PCR amplification with primers specific for Rag-1 (25 cycles), or actin (13 cycles). (C) μE5, EBF, Pax-5, and Oct DNA binding activity in EBF- expressing macrophage cell lines. 10 μg of nuclear extract from each of the indicated cell lines was incubated with a 32P-labeled oligonucleotide probe containing the binding site for E2A (μE5), EBF, Pax-5, and Oct.

Similar articles

Cited by

References

    1. Till JE, McCulloch EA. Hemopoietic stem cell differentiation. Biochim Biophys Acta. 1980;605:431–459. - PubMed
    1. Cumano A, Paige CJ. Enrichment and characterization of uncommitted B-cell precursors from fetal liver at day 12 of gestation. EMBO (Eur Mol Biol Organ) J. 1992;11:593–601. - PMC - PubMed
    1. Billips LG, Petitte D, Dorshkind K, Narayanan R, Chiu C-P, Landreth KS. Differential roles of stromal cells, interleukin-7, and kit-ligand in the regulation of B lymphopoiesis. Blood. 1992;79:1185–1192. - PubMed
    1. Yancopoulos GD, Alt FW. Regulation of the assembly and expression of variable-region genes. Annu Rev Immunol. 1986;4:339–368. - PubMed
    1. Schatz DG, Oettinger MA, Baltimore D. The V(D)J recombination activating gene, RAG-1. Cell. 1989;59:1035–1048. - PubMed

Publication types

MeSH terms

Substances