. 1998 Jul 15;510 ( Pt 2)(Pt 2):347-60.
doi: 10.1111/j.1469-7793.1998.347bk.x.

The effect of overexpression of auxiliary Ca2+ channel subunits on native Ca2+ channel currents in undifferentiated mammalian NG108-15 cells

Affiliations

The effect of overexpression of auxiliary Ca2+ channel subunits on native Ca2+ channel currents in undifferentiated mammalian NG108-15 cells

C N Wyatt et al. J Physiol. .

Abstract

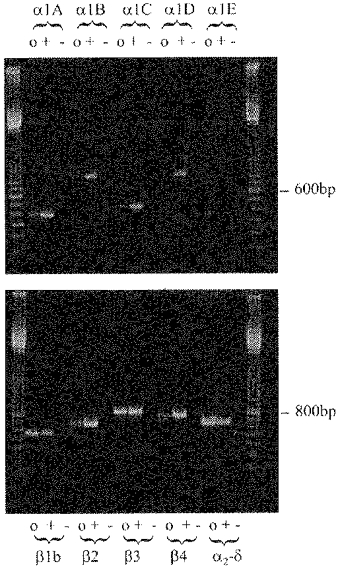
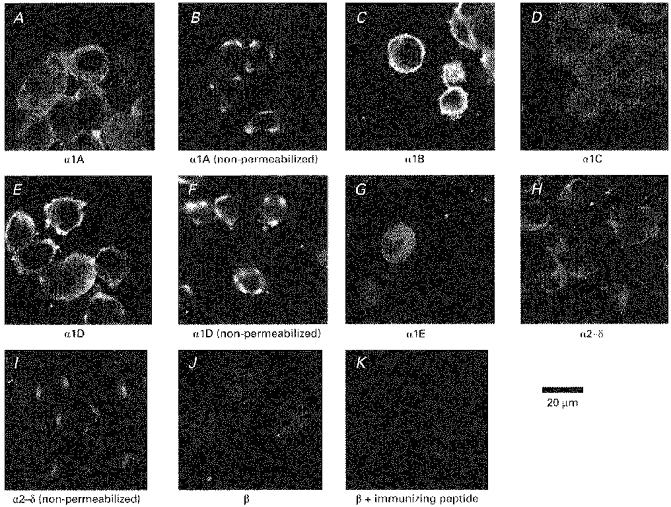
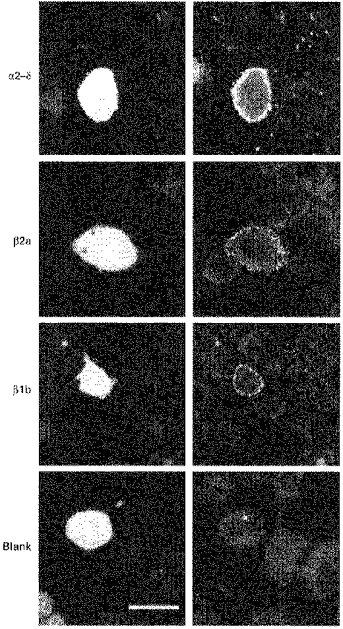
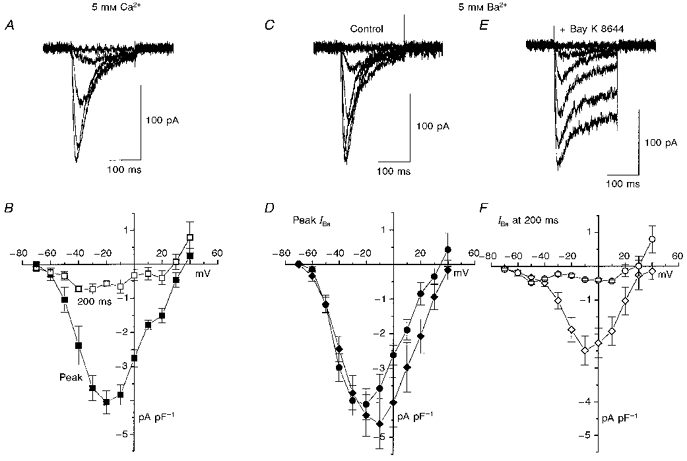
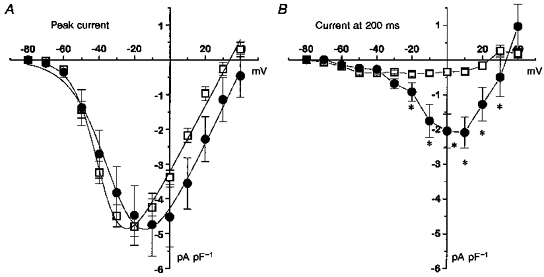
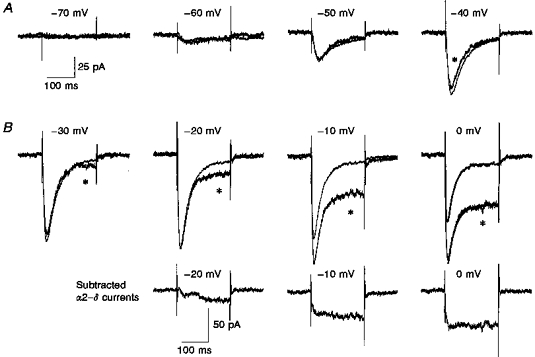
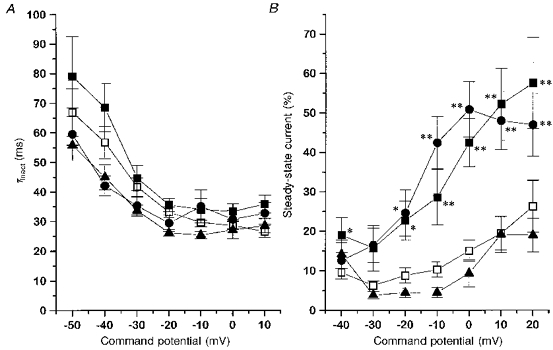
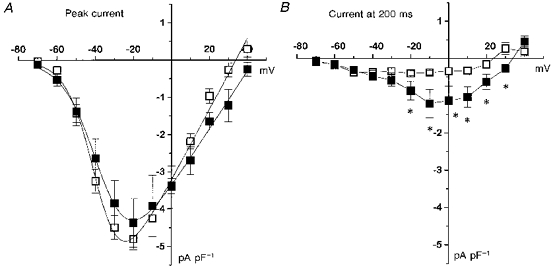
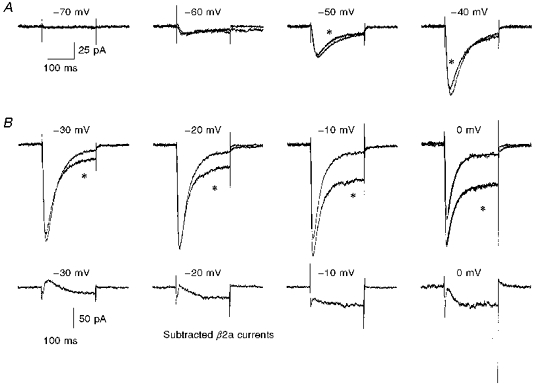
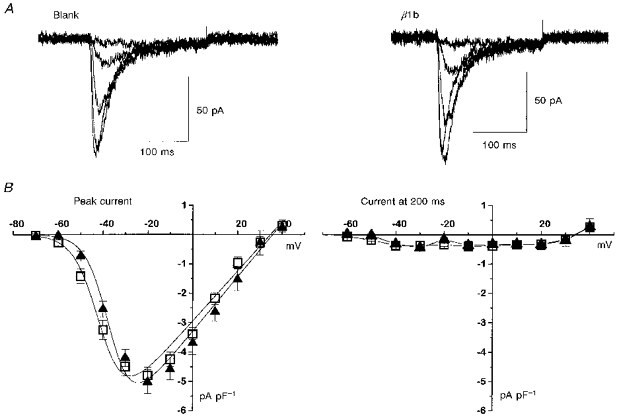
1. High voltage activated (HVA) Ca2+ channels are composed of a pore-forming alpha 1 subunit and the accessory beta and alpha2-delta subunits. However, the subunit composition of low voltage activated (LVA), or T-type, Ca2+ channels has yet to be elucidated. We have examined whether native calcium channels in NG108-15 mouse neuroblastoma x rat glioma hybrid cells, which express predominantly LVA currents when undifferentiated, are modulated by overexpression of accessory calcium channel subunits. 2. Endogenous alpha 1A, B, C, C, and E, and low levels of beta and alpha 2-delta subunit protein were demonstrated in undifferentiated NG108-15 cells. 3. The alpha 2-delta, beta 2a or beta 1b accessory subunits were overexpressed by transfection of the cDNAs into these cells, and the effect examined on the endogenous Ca2+ channel currents. Heterologous expression, particularly of alpha 2-delta but also of beta 2a subunits clearly affected the profile of these currents. Both subunits induced a sustained component in the currents evoked by depolarizing voltages above -30 mV, and alpha 2-delta additionally caused a depolarization in the voltage dependence of current activation, suggesting that it also affected the native T-type currents. In contrast, beta 1b overexpression had no effect on the endogenous Ca2+ currents, despite immunocytochemical evidence for its expression in the transfected cells. 4 These results suggest that in NG108-15 cells, overexpression of the Ca2+ channel accessory subunits alpha 2-delta and beta 2a induce a sustained component of HVA current, and alpha 2-delta also influences the voltage dependence of activation of the LVA current. It is possible that native T-type alpha 1 subunits are not associated with beta subunits.


Figures

Figure 1
Figure 1. RT-PCR detection of calcium channel α1A, α1B, α1C, α1E, α2–δ, β1b, β2, β3 and β4 subunit mRNA in undifferentiated NG108-15 cells
Primer sequences are given in Methods. For each primer pair, a mix was made up and divided into the following: o, NG108-15 reverse-transcribed aliquot; +, rat brain cDNA (10 pg) (positive control); -, water (negative control). DNA markers are 100 bp ladder. All mRNAs were detected except that of α1D.
Figure 2
Figure 2. Immunostaining for endogenous calcium channel α1, α2–δ and β subunits in undifferentiated NG108-15 cells
Undifferentiated NG108-15 cells were fixed and stained for the α1, α2–δ and β subunits as described in Methods. Cells were permeabilized, where stated, to enable the primary antibody to reach its intracellular epitope. A, α1A (permeabilized); B, α1A (non-permeabilized, depolarized); C, α1B (permeabilized); D, α1C (permeabilized); E, α1D (permeabilized); F, α1D (non-permeabilized, depolarized); G, α1E (permeabilized); H, α2–δ (permeabilized); I, α2–δ (non-permeabilized); J, β (permeabilized); K, control (β subunit antibody preincubated with immunizing peptide). Where stated, cells were depolarized before fixation, as described in Methods, to expose an exofacial epitope on α1A or α1D.
Figure 3
Figure 3. Immunostaining for overexpressed calcium channel subunits in NG108-15 cells transfected with α2–δ, β2a and β1b
Undifferentiated NG108-15 cells were transfected with α2–δ, β2a, β1b and blank plasmid, together with GFP, fixed 48 h after transfection, and stained for the transfected subunit as described in Methods, except ‘Blank’ which was stained for β subunit. The left panel shows the cell in the field that was GFP positive and the right panel shows immunostaining for the respective subunit. No staining was observed using preimmune serum as a control (not shown). Scale bar, 15 μm.
Figure 4
Figure 4. Effect of the L-channel agonist Bay K 8644 on T-type calcium currents in undifferentiated NG108-15 cells
A, examples of current traces from undifferentiated NG108-15 cells recorded with 5 mM Ca2+ (200 ms voltage steps to test potentials from −70 to −30 mV in 10 mV steps). B, mean (±s.e.m.) current-voltage relationships for peak calcium current (ICa; ▪) and ICa at end of 200 ms step (□, n = 7). C and E, examples of current traces from undifferentiated NG108-15 cells recorded with 5 mM Ba2+ (-60 to −20 mV test potentials), under control conditions (C) and in the presence of 1 μM S-(-)-Bay K 8644 (E). D, mean (±s.e.m.) current-voltage relationships for peak barium current (IBa) in control conditions (•, n = 5) and in the presence of Bay K 8644 (♦, n = 8). F, mean (±s.e.m.) current-voltage relationships for IBa at end of 200 ms step in control conditions (^) and in the presence of Bay K 8644 (⋄).
Figure 5
Figure 5. Effect of overexpression of α2–δ on T-type calcium currents in undifferentiated NG108-15 cells
Cells were transfected with α2–δ or blank vector, and Ca2+ channel currents were recorded 48–72 h later. A, I-V relationships for peak current (means ±s.e.m., n as in Table 1) in α2–δ- (•) and blank- (□) transfected cells. The peak I-V relationships are fitted by a Boltzmann equation as in the legend to Table 1, where Gmax is 0.095 nS pF−1 for control and 0.11 nS pF−1 for α2–δ, Vrev is +33.9 mV for control and +43.0 mV for α2–δ, k is 7.2 mV for control and 10.9 mV for α2–δ, and V½ is −45.7 mV for control and −40.5 mV for α2–δ. B, I-V relationships for α2–δ- (•) and blank- (□) transfected cells for current at 200 ms. *P < 0.01 for current amplitude in α2–δ compared with blank-transfected cells.
Figure 6
Figure 6. Calcium currents in undifferentiated NG108-15 cells in the presence of overexpressed α2–δ, compared with normalized controls
A, calcium channel currents between −70 and 0 mV were averaged for 9 cells (overexpressed α2–δ, traces marked with *) and 21 cells (control). The control values were then normalized to the peak amplitude at −20 mV to compare inactivation properties between the two conditions. The amplitude scale bar refers to the α2–δ traces. Examples of the fits to a single exponential of the current inactivation phase are shown for the 0 mV traces (continuous curves). The τinact was 26.8 and 30.5 ms for the currents in the control and α2–δ-overexpressing cells, respectively. B, the averaged currents in the presence of overexpressed α2–δ were subtracted from the control currents for −20, −10 and 0 mV to show the additional slowly activating current component appearing at large depolarizations.
Figure 7
Figure 7. The effect of overexpression of β2a, β1b and α2–δ on the time constant of inactivation of Ca2+ channel currents, and the proportion of steady state current in undifferentiated NG108-15 cells
A, the time constant of inactivation (τinact) was determined for individual Ca2+ channel currents recorded from β2a- (▪), β1b- (▴), α2–δ- (•) and blank- (□) transfected cells, by fitting a single exponential curve to the decaying phase of the current. B, the percentage steady-state current was calculated from the exponential fits, and the same symbols are used as in A. *P < 0.05, **P < 0.01 compared with blank-transfected cells.
Figure 8
Figure 8. Effect of overexpression of β2a on T-type calcium currents in undifferentiated NG108-15 cells
Cells were transfected with β2a or blank vector, and Ca2+ channel currents were recorded 48–72 h later. A, current-voltage (I-V) relationships for peak current (means ±s.e.m., n as in Table 1) in β2a- (▪) and blank- (□) transfected cells. The I-V relationships for the peak current are fitted by a Boltzmann equation, as in the legend to Table 1, where Gmax is 0.095 nS pF−1 for control and 0.078 nS pF−1 for β2a, Vrev is +33.9 mV for control and +43.7 mV for β2a, k is 7.2 mV for control and 8.9 mV for β2a, and V½ is −45.7 mV for control and −45.4 mV for β2a. B, I-V relationships for β2a- (▪) and blank- (□) transfected cells for current at 200 ms. *P < 0.05 for current amplitude in β2a- compared with blank-transfected cells.
Figure 9
Figure 9. Ca2+ channel currents in undifferentiated NG108-15 cells in the presence of overexpressed β2a, compared with normalized controls
A, calcium channel currents between −70 and 0 mV were averaged for 11 cells (overexpressed β2a, traces marked with *) and 21 cells (control, blank transfected). The control values were then normalized to the peak amplitude at −20 mV to compare inactivation properties between the two conditions. The amplitude scale bar refers to the β2a traces. Examples of the fits to a single exponential of the current inactivation phase are shown for the 0 mV traces (continuous curves). The τinact was 26.8 and 29.3 ms for the currents in the control and β2a-overexpressing cells, respectively. B, the averaged currents in the presence of overexpressed β2a were subtracted from the control currents at −30, −20, −10 and 0 mV to show the additional slowly activating current component appearing at large depolarizations.
Figure 10
Figure 10. Effect of overexpression of β1b on T-type calcium currents in undifferentiated NG108-15 cells
Cells were transfected with β1b or blank vector, and Ca2+ channel currents were recorded 48–72 h later. A, examples of current traces for blank- (left) and β1b- (right) transfected cells; 200 ms voltage steps were applied in 10 mV intervals to between −50 and −10 mV (blank-transfected cell) and −60 and −20 mV (β1b-transfected cell). B, current-voltage (I-V) relationships (means ±s.e.m., n as in Table 1) for β1b- (▴) and blank- (□) transfected cells for peak current (left) and current at 200 ms (right). The peak I-V relationships are fitted by a Boltzmann equation as in the legend to Table 1, where Gmax is 0.085 nS pF−1 for control and 0.09 nS pF−1 for β1b, Vrev is +34.7 mV for control and +35.7 mV for β1b, k is 5.7 mV for control and 5.2 mV for β1b, and V½ is −46.5 mV for control and −41.7 mV for β1b.

Similar articles

Cited by

References

    1. Berrow NS, Campbell V, Fitzgerald EG, Brickley K, Dolphin AC. Antisense depletion of β-subunits modulates the biophysical and pharmacological properties of neuronal calcium channels. The Journal of Physiology. 1995;482:481–491. - PMC - PubMed
    1. Bossu J-L, Feltz A. Patch-clamp study of the tetrodotoxin-resistant sodium current in group C sensory neurones. Neuroscience Letters. 1984;51:241–246. - PubMed
    1. Bourinet E, Zamponi GW, Stea A, Soong TW, Lewis BA, Jones LP, Yue DT, Snutch TP. The α1E calcium channel exhibits permeation properties similar to low-voltage-activated calcium channels. Journal of Neuroscience. 1996;16:4983–4993. - PMC - PubMed
    1. Brice NL, Berrow NS, Campbell V, Page KM, Brickley K, Tedder I, Dolphin AC. Importance of the different β subunits in the membrane expression of the α1A and α2 calcium channel subunits: studies using a depolarisation-sensitive α1A antibody. European Journal of Neuroscience. 1997;9:749–759. - PubMed
    1. Brickley K, Campbell V, Berrow N, Leach R, Norman RI, Wray D, Dolphin AC, Baldwin S. Use of site-directed antibodies to probe the topography of the α2 subunit of voltage-gated Ca2+ channels. FEBS Letters. 1995;364:129–133. - PubMed

Publication types

Substances

LinkOut - more resources