

Calcineurin involvement in the regulation of high-threshold Ca2+ channels in NG108-15 (rodent neuroblastoma x glioma hybrid) cells
- PMID: 9705990
- PMCID: PMC2231037
- DOI: 10.1111/j.1469-7793.1998.371bk.x
Calcineurin involvement in the regulation of high-threshold Ca2+ channels in NG108-15 (rodent neuroblastoma x glioma hybrid) cells
Abstract
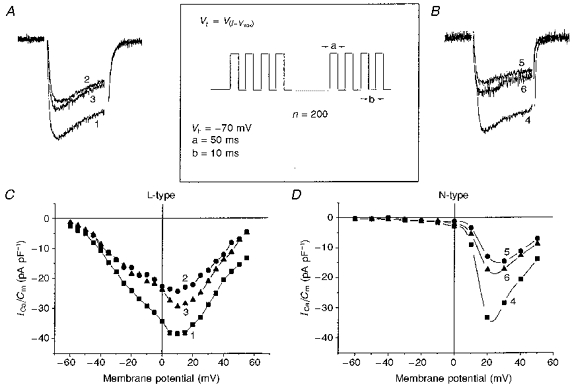
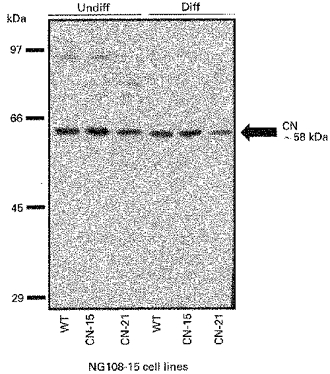
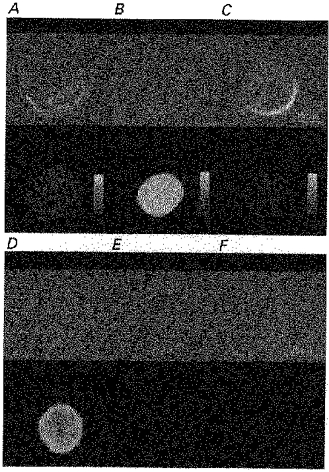
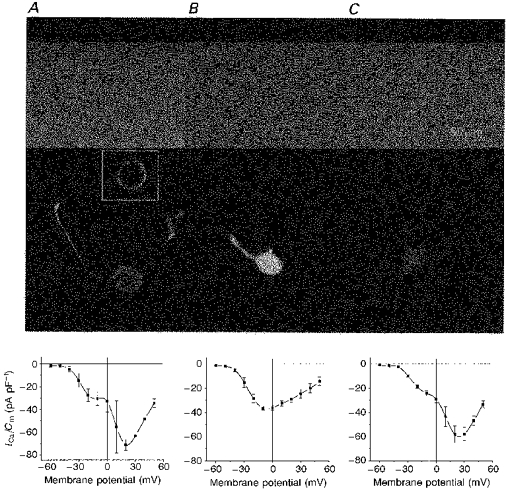
1. We examined the relationship between calcineurin (protein phosphatase 2B (PP2B) and voltage-operated Ca2+ channels (VOCCs) in NG108-15 cells. PP2B expression in NG108-15 cells was altered by transfection with plasmid constructs containing a full length cDNA of human PP2B beta(3) in sense (CN-15) and antisense (CN-21) orientation. 2. Confocal immunocytochemical localization showed that in wild-type cells, PP2B immunoreactivity is uniformly distributed in undifferentiated cells and located at the inner surface of soma membrane and neurites in differentiated cells. 3. To test the Ca2+ dependence of the VOCC, we used high-frequency stimulation (HFS). The L- and N-type VOCCs decreased by 37 and 52%, respectively, whereas the T-type current was only marginally sensitive to this procedure. FK-506 (2 microM), a specific blocker of PP2B, reduced the inhibition of L- and N-type VOCCs induced by HFS by 30 and 33%, respectively. 4. In CN-15-transfected cells overexpressing PP2B, total high-voltage-activated (HVA) VOCCs were suppressed by about 60% at a test potential of +20 mV. Intracellular addition of EGTA or FK-506 into CN-15-transfected cells induced an up to 5-fold increase of HVA VOCCs. 5. These findings indicate that PP2B activity does not influence the expression of HVA Ca2+ channels, but modulates their function by Ca(2+)-dependent dephosphorylation. Thus HVA VOCCs, in a phosphorylated state under control conditions, are downregulated by PP2B upon stimulation, with the major effect on N-type VOCCs.
Figures
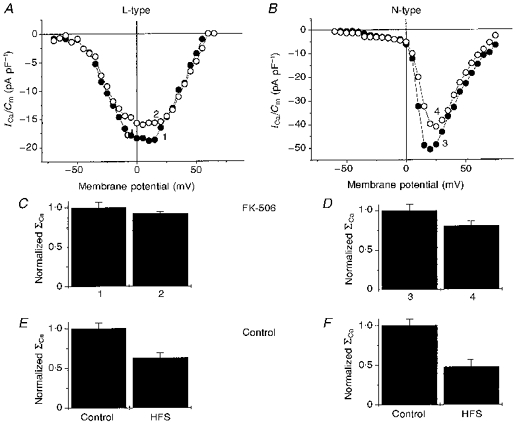
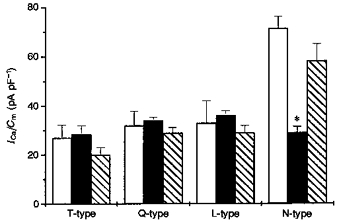
 )-transfected cells. Each histogram value represents the values calculated from data presented in Fig. 8. *P < 0·0002 with respect to control.
Similar articles
-
The effect of overexpression of auxiliary Ca2+ channel subunits on native Ca2+ channel currents in undifferentiated mammalian NG108-15 cells.J Physiol. 1998 Jul 15;510 ( Pt 2)(Pt 2):347-60. doi: 10.1111/j.1469-7793.1998.347bk.x. J Physiol. 1998. PMID: 9705988 Free PMC article.
-
A modulatory role for protein phosphatase 2B (calcineurin) in the regulation of Ca2+ entry.Eur J Neurosci. 2000 Aug;12(8):2881-91. doi: 10.1046/j.1460-9568.2000.00178.x. Eur J Neurosci. 2000. PMID: 10971631
-
Ca2+ influx through voltage-gated Ca2+ channels regulates 5-HT3 receptor channel desensitization in rat glioma x mouse neuroblastoma hybrid NG108-15 cells.J Physiol. 1998 Jul 15;510 ( Pt 2)(Pt 2):361-70. doi: 10.1111/j.1469-7793.1998.361bk.x. J Physiol. 1998. PMID: 9705989 Free PMC article.
-
Modulation of high-voltage activated Ca2+ channels in the rat periaqueductal gray neurons by mu-type opioid agonist.J Neurophysiol. 1997 Mar;77(3):1418-24. doi: 10.1152/jn.1997.77.3.1418. J Neurophysiol. 1997. PMID: 9084607
-
Ca(2+) channel properties in neuroendocrine tumor cell cultures investigated by whole-cell patch-clamp technique.Ann N Y Acad Sci. 2004 Apr;1014:137-9. doi: 10.1196/annals.1294.014. Ann N Y Acad Sci. 2004. PMID: 15153428 Review.
Cited by
-
Modulation of calcium-dependent inactivation of L-type Ca2+ channels via β-adrenergic signaling in thalamocortical relay neurons.PLoS One. 2011;6(12):e27474. doi: 10.1371/journal.pone.0027474. Epub 2011 Dec 2. PLoS One. 2011. PMID: 22164209 Free PMC article.
-
Modulation of Ca²⁺ signals by epigallocatechin-3-gallate(EGCG) in cultured rat hippocampal neurons.Int J Mol Sci. 2011 Jan 20;12(1):742-54. doi: 10.3390/ijms12010742. Int J Mol Sci. 2011. PMID: 21340011 Free PMC article.
-
Calcineurin enhances L-type Ca(2+) channel activity in hippocampal neurons: increased effect with age in culture.Neuroscience. 2002;110(2):213-25. doi: 10.1016/s0306-4522(01)00574-7. Neuroscience. 2002. PMID: 11958864 Free PMC article.
-
Calcineurin plays different roles in group II metabotropic glutamate receptor- and NMDA receptor-dependent long-term depression.J Neurosci. 2002 Jun 15;22(12):5034-41. doi: 10.1523/JNEUROSCI.22-12-05034.2002. J Neurosci. 2002. PMID: 12077199 Free PMC article.
-
D2 dopamine receptors in striatal medium spiny neurons reduce L-type Ca2+ currents and excitability via a novel PLC[beta]1-IP3-calcineurin-signaling cascade.J Neurosci. 2000 Dec 15;20(24):8987-95. doi: 10.1523/JNEUROSCI.20-24-08987.2000. J Neurosci. 2000. PMID: 11124974 Free PMC article.
References
-
- Armstrong DL. Calcium channel regulation by calcineurin, a Ca2+-activated phosphatase in mammalian brain. Trends in Neurosciences. 1989;12:117–122. 10.1016/0166-2236(89)90168-9. - DOI - PubMed
-
- Brown DA, Docherty RJ, McFadzean I. Calcium channels in vertebrate neurons. Experiments on neuroblastoma hybrid model. Annals of the New York Academy of Sciences. 1989;560:358–372. - PubMed
-
- Buisson B, Laflamme L, Bottari SP, Gasparo M, Gallo-Payet N, Payet MA. G-protein is involved in the angiotensin AT2 receptor inhibition of the T-type calcium current in non-differentiated NG108-15 cells. Journal of Biological Chemistry. 1992;270:1670–1674. - PubMed
Publication types
MeSH terms
Substances
Grants and funding
LinkOut - more resources
Full Text Sources
Miscellaneous