. 1998 Jul 15;510 ( Pt 2)(Pt 2):401-20.
doi: 10.1111/j.1469-7793.1998.401bk.x.

High-affinity kainate-type ion channels in rat cerebellar granule cells

Affiliations

High-affinity kainate-type ion channels in rat cerebellar granule cells

K E Pemberton et al. J Physiol. .

Abstract

1. Patch-clamp recordings were made from rat cerebellar granule cells in primary culture. In cells pre-exposed to concanavalin A (ConA) to remove kainate receptor desensitization, concentration-response data for kainate showed two components. The EC50 value for the high-affinity component (4 microM) was consistent with activation of kainate-type channels. ConA enhanced the apparent potency of the kainate receptor ligand SYM 2081 by 100-fold. 2. In ConA-treated granule cells, currents evoked by 10 microM kainate were not significantly reduced by the AMPA receptor antagonist GYKI 53655, nor were these currents significantly reduced by the co-application of 100 microM AMPA. Currents activated by low concentrations of kainate in the presence of AMPA were completely inhibited by 10 microM La3+. 3. Single-cell reverse transcriptase-polymerase chain reaction (RT-PCR) analysis indicated that granule cells express both unedited (Q) and edited (R) versions of GluR5, with the majority of the GluR5 transcripts being unedited. In contrast, BluR6(R) was detected in seven cells and GluR6(Q) was detected in one granule cell. 4. Whole-cell current-voltage curves for kainate-type currents in granule cells were measured and the ratio of the slope conductances at +40 MV and -40 mV was used as an index of rectification. The mean +40 mV/-40 mV ratio determined from thirty-six granule cells was 1.3 +/- 0.1. Spectral density analysis of kainate-evoked whole-cell current noise gave values for the apparent single-channel conductance, gamma(noise), that were on average about 1 pS. 5. To compare further the properties of recombinant kainate channels with the native kainate-type channels in granule cells, we determined EC50 and gamma(noise) values for SYM 2081 in stable cell lines expressing either (GluR6(R) or GluR6(R) and KA2. Co-expression of KA2 with GluR6(R) shifts the EC50 and gamma(noise) values determined for SYM 2081 closer to the values typically found for native kainate-type channels in granule cells. 6. The results demonstrate that cerebellar granule cells in culture express functional kainate-type channels and that in most cells these channels show properties that are similar to those determined for heteromeric channels formed from GluR6(R) and KA2. However, the results also suggest that different granule cells express different repertoires of kainate-type channels with different, and perhaps variable, subunit composition.


Figures
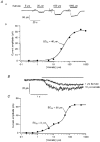
Figure 1
Figure 1. Pretreatment of cerebellar granule cells with ConA reveals high-affinity kainate-type currents
Aa, whole-cell currents evoked at −80 mV by increasing concentrations of kainate in a cerebellar granule cell not exposed to ConA. Note the lack of a response to 5 μM kainate. Breaks in the record are indicated by the diagonal bars. Ab, concentration-response curve for steady-state currents evoked by kainate from the same granule cell as in Aa. The Hill-type fit to the data gave an EC50 of 46 μM. B, whole-cell currents evoked at −80 mV by 1 and 10 μM kainate in a granule cell pre-exposed to ConA. Kainate applications are denoted by the bar above the traces. C, concentration-response curve for kainate in a granule cell that was pretreated with ConA (different cell from that in B). The smooth line shows the two-component Hill-type fit to the results which gave EC50 values of 5 and 56 μM for the high- and low-affinity components, respectively.
Figure 2
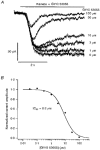
Figure 2. Kainate-evoked currents in granule cells not pre-exposed to ConA are blocked by the AMPA-receptor antagonist GYKI 53655
A, whole-cell currents evoked by 200 μM kainate in a granule cell held at −80 mV in the presence of increasing concentrations of GYKI 53655. The cell was not pretreated with ConA. Portions of the continuous record are displayed so that the onsets of the applications (bar above the traces) are aligned. Kainate and GYKI 53655 were applied simultaneously; the time-dependent fade of the currents reflects the slow kinetics of the GYKI 53655 inhibition. Concentrations of GYKI 53655 are shown to the right of each trace. B, concentration-response curve for GYKI 53655 inhibition of steady-state currents evoked by 200 μM kainate (same cell as in A). The fit to the results (smooth curve) gave an IC50 of 8.2 μM.
Figure 3
Figure 3. High-affinity kainate-type currents in ConA-treated granule cells are resistant to block by GYKI 53655
A, whole-cell currents evoked at −80 mV by 10 μM kainate in the absence (a) and presence (b) of 100 μM GYKI 53655 in a ConA-treated granule cell. B, bar-graph showing the mean steady-state amplitude of whole-cell currents evoked in 4 ConA-treated granule cells by 10 μM kainate (left) and 100 μM kainate (right) in both the absence (control, □) and presence of 100 μM GYKI 53655 (▪). Error bars indicate s.e.m. The currents elicited by 10 μM kainate were little affected by the non-competitive AMPA receptor antagonist, whereas the currents evoked by 100 μM kainate were reduced in size to amplitudes similar to those seen with 10 μM kainate. C, kainate concentration-response data from a granule cell pretreated with ConA in the absence (control, •) and presence (^) of 100 μM GYKI 53655. The two-component fit to the results obtained in the absence of GYKI 53655 gave EC50 values of 1.9 and 96 μM. GYKI 53655 blocks the low-affinity, but not the high-affinity, component.
Figure 4
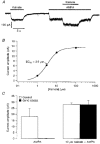
Figure 4. Kainate-type currents in ConA-treated granule cells are insensitive to the concurrent application of AMPA and GYKI 53655
A, whole-cell currents evoked at −80 mV by 10 μM kainate alone, and by 10 μM kainate in the presence of 100 μM AMPA, in a granule cell pretreated with ConA. Agonist applications are indicated by bars above the record. B, concentration-response curve for currents evoked by kainate in the presence of 100 μM AMPA in a ConA-treated granule cell (different cell from that in A). The Hill-type fit to the data gave an EC50 value of 3.2 μM. C, bar-graph showing the mean amplitude of currents evoked by 100 μM AMPA (left) and by 10 μM kainate during the concurrent application of 100 μM AMPA (right). The respective currents were measured in each of 5 granule cells in the absence (control, □) and presence of 100 μM GYKI 53655 (▪). Applications of GYKI 53655 that virtually abolished currents evoked by AMPA had no effect on the currents evoked by 10 μM kainate. Error bars indicate the s.e.m.
Figure 5
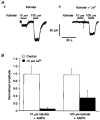
Figure 5. Kainate-type currents are blocked by lanthanum
A, whole-cell currents evoked in a ConA-treated granule cell by kainate (10 and 100 μM) in the absence (a) and presence (b) of 10 μM La3+. Agonist applications are indicated by the bars above the traces. B, bar-graph showing the mean amplitude of the currents evoked by 10 μM kainate (left) and 100 μM kainate (right) in the absence (control, □) and presence (▪) of 10 μM La3+. The respective currents were measured in 6 granule cells during the concurrent application of 100 μM AMPA and were normalized to the size of the current evoked in each cell by 10 μM kainate alone. Error bars indicate s.e.m.
Figure 6
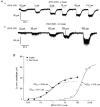
Figure 6. Pretreatment of granule cells with ConA reveals activation by SYM 2081 of high-affinity kainate-type currents
A, whole-cell currents evoked at −80 mV by increasing concentrations of SYM 2081 in 2 granule cells that either were (a) or were not (b) pretreated with ConA. B, concentration-response data from the complete set of results obtained for the cells in Aa and Ab: •, data from a cell exposed to ConA; ^, results from a granule cell not pretreated with ConA. Continuous lines are one-component Hill-type fits to each set of data. The fit to the results obtained from the cell pretreated with ConA gave an EC50 value of 0.95 μM, whereas the corresponding value obtained from the cell not exposed to ConA was 216 μM. The dashed line indicates the Hill-type fit that was obtained for the results from the ConA-treated granule cell when the data for SYM 2081 concentrations of 10 μM and above were excluded (EC50= 0.51 μM).
Figure 7
Figure 7. Rectification of kainate-type channels in granule cells
A and B, I-V relationships for steady-state currents evoked by 10 μM kainate in the presence of 100 μM AMPA from 2 different cerebellar granule cells. Currents were measured during 500 ms voltage ramps from −80 to +80 mV. The results are the difference currents obtained by subtracting the currents during application of 100 μM AMPA from the currents during the concurrent application of 100 μM AMPA and 10 μM kainate. The smooth curves are fourth-order polynomial fits to the results. C and D, the first derivative of the polynomial fits to the results in A and B, respectively. The values of the function at +40 and −40 mV were used to determine the ratio of the slope conductances at these membrane potentials.
Figure 8
Figure 8. Apparent unitary conductance of kainate-type channels in granule cells
Whole-cell currents evoked at −80 mV by 10 μM kainate in the presence of 100 μM AMPA (A), and by 10 μM SYM 2081 in the presence of 100 μM GYKI 53655 (C) in 2 different ConA-treated granule cells. Agonist applications are indicated by the bars above the traces. In C, SYM 2081 and GYKI 53655 were applied simultaneously. B and D show the power spectra obtained from spectral density analysis of the current noise evoked by 10 μM kainate and 10 μM SYM 2081 during the responses shown in A and C, respectively. The power spectrum for the kainate-evoked noise was fitted (continuous curve) with the sum of two Lorentzian components with respective half-power frequencies of 45 and 202 Hz (dashed curves). The fit gave a γnoise value of 1.0 pS. The single Lorentzian fit to the SYM 2081 results gave a γnoise value of 1.1 pS.
Figure 9
Figure 9. RT-PCR analysis of GluR5 and GluR6 editing in single cerebellar granule cells
A, GluR5 RT-PCR amplification products from 3 granule cells. The samples were separated on a 6% polyacrylamide gel that was stained with ethidium bromide and photographed. The lane marked (-) contains undigested RT-PCR products. Lanes 1–3 show RT-PCR products from each cell after digestion with BbvI. The sizes of the uncut GluR5 product (313 bp) and the edited (R, 187 bp) and unedited (Q, 106 bp) restriction fragments are indicated at the sides of each panel. The lane labelled M contains a 1 kb DNA ladder (Life Sciences) as a size standard. B, sequence analysis of GluR6-specific RT-PCR products obtained from 2 granule cells (GC-5–4 and GC-5-3). The position of the Q/R site is indicated. Note that for both cells a termination signal is only detected in the ddG lane.
Figure 10
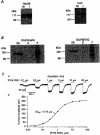
Figure 10. GluR6 and KA2 protein expression and agonist affinity in HEK 293 cells stably expressing both subunits
A, Western blots of total cellular protein from HEK 293 cells stably expressing the GluR6 and KA2 subunits. The immunoblots were probed with anti-GluR6/7 (left) or anti-KA2 (right) antibody. The cells were harvested before (NI) and 5 days after (I) inducing expression of GluR6 and KA2 by removing tetracycline from the media. Note that the background expression of KA2 in the presence of tetracycline is lower than the corresponding expression of GluR6, and that the subsequent induction of expression is greater. B, detergent extracts of total cellular protein from cells stably expressing GluR6-KA2 were immunoprecipitated with anti-KA2 (left) or anti-GluR6/7 (right) antibody. Aliquots of the detergent extracts (DE) and postimmunoprecipitate supernatants (S) and pellets (P) were subjected to SDS-PAGE and immunoblotted with anti-GluR6/7 (left) or anti-KA2 (right) antibody. The positions of 120 and 85 kDa molecular weight standards are shown. C, whole-cell currents (a) evoked at −80 mV by increasing concentrations of SYM 2081, and the resultant concentration-response data (b), in a ConA-treated HEK 293 cell stably expressing the GluR6(R) and KA2 subunits. SYM 2081 applications are indicated by bars above the current traces. The fit to the results gave an EC50 value of 0.74 μM.
Figure 11
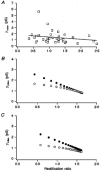
Figure 11. Relationship between γnoise and rectification ratio
A, γnoise values determined for kainate-type currents that were obtained from 36 individual granule cells are plotted against the +40 mV/-40 mV ratio determined fom the same cell. The line shows regression analysis of the results. One point (3.6, 1.12 pS) is off scale to the right. B, values of the apparent unitary conductance (determined at −80 mV) and rectification ratio that are expected to be obtained from cells expressing different relative amounts of homomeric GluR6(R) and homomeric GluR5(Q) channels. The +40 mV/-40 mV ratios were calculated as the ratio of the whole-cell currents at these membrane potentials, which gives values similar to the ratio of slope conductances for currents that reverse near 0 mV. The respective values for γnoise and the +40 mV/-40 mV ratio were taken to be 0.25 pS and 2.0, respectively, for the GluR6(R) homomers, and 3 pS and 0.1, respectively, for the GluR5(Q) homomeric channels. •, results when it was assumed that the Po for each channel subtype was similarly low and the GluR6(R):GluR5(Q) ratio was varied from 2.5 to 50 in constant increments. ^, results when the Po values for GluR6(R) and GluR5(Q) channels were taken to be 0.2 and 0.5, respectively, and were included in calculation of γnoise. The GluR6(R):GluR5(Q) ratio was varied from 1 to 20. C, predicted relationship between γnoise and the +40 mV/-40 mV ratio for mixed populations of GluR6(R), GluR5(Q), and GluR6(R)/KA2 channels (γnoise= 0.6 pS, +40 mV/40 mV ratio = 1.5). •, results if it was assumed that the Po was low for each population. The ratio of GluR6(R) to GluR5(Q) homomers was varied from 1 to 50 and the ratio of GluR6(R) to GluR6(R)/KA2 channels was varied from 1 to 4 (in constant increments). ^, results when the Po for the 2 populations of GluR6(R)-containing channels was taken to be be 0.2 and the Po for the GluR5(Q) channels was taken to be 0.5. The GluR6(R):GluR5(Q) ratio was varied from 1 to 20.

Similar articles

Cited by

References

    1. Bahn S, Volk B, Wisden W. Kainate receptor gene expression in the developing rat brain. Journal of Neuroscience. 1994;14:5525–5547. - PMC - PubMed
    1. Bähring R, Bowie D, Benveniste M, Mayer ML. Permeation and block of rat GluR6 glutamate receptor channels by internal and external polyamines. The Journal of Physiology. 1997;502:575–590. - PMC - PubMed
    1. Belcher SM, Howe JR. Characterization of RNA editing of the glutamate-receptor subunits GluR5 and GluR6 in granule cells during cerebellar development. Molecular Brain Research. 1997;52:139–148. 10.1016/S0169-328X(97)00231-3. - DOI - PubMed
    1. Bettler B, Boulter J, Hermans-Borgmeyer I, O'Shea-Greenfield A, Deneris E, Moll C, Borgmeyer U, Hollmann M, Heinemann S. Cloning of a novel glutamate receptor subunit, GluR5: expression in the nervous system during development. Neuron. 1990;5:583–595. - PubMed
    1. Bettler B, Mülle C. Review: neurotransmitter receptors. II. AMPA and kainate receptors. Neuropharmacology. 1995;34:123–139. - PubMed

Publication types

MeSH terms

LinkOut - more resources