. 1998 Jul 15;510 ( Pt 2)(Pt 2):499-512.
doi: 10.1111/j.1469-7793.1998.499bk.x.

Intracellular calcium clearance in Purkinje cell somata from rat cerebellar slices

Affiliations

Intracellular calcium clearance in Purkinje cell somata from rat cerebellar slices

L Fierro et al. J Physiol. .

Abstract

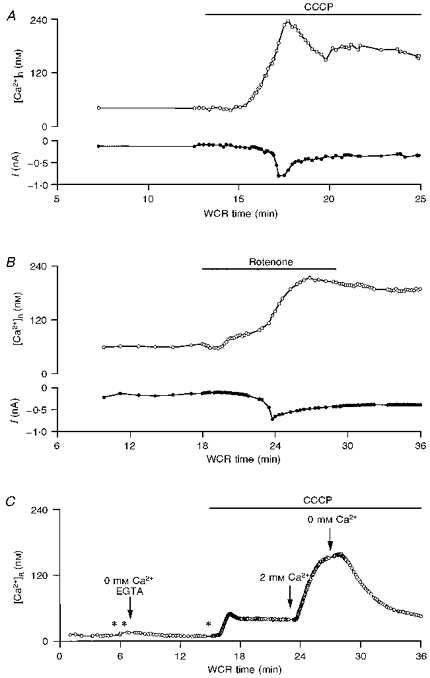
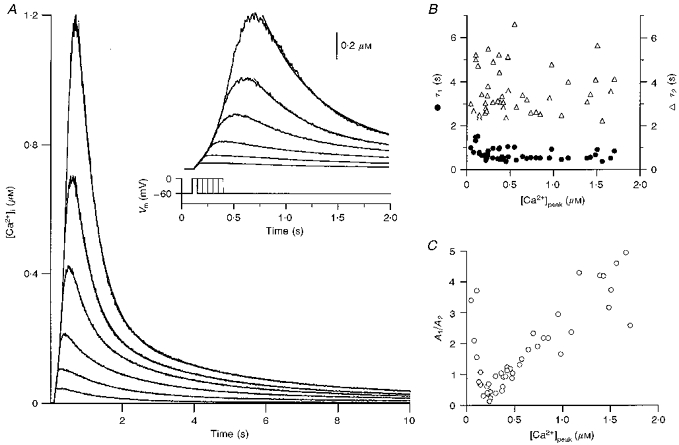
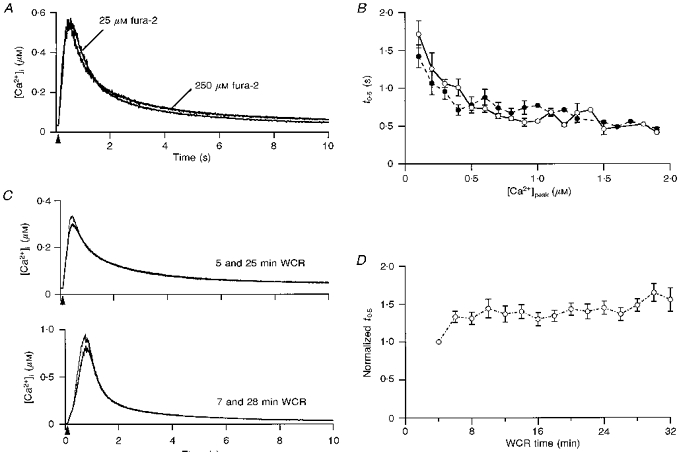
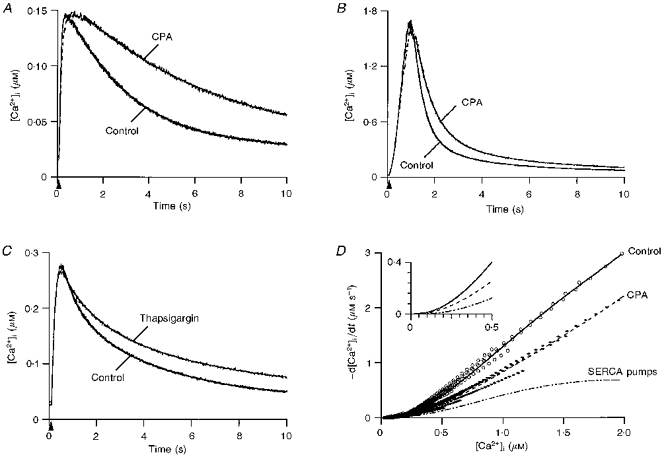
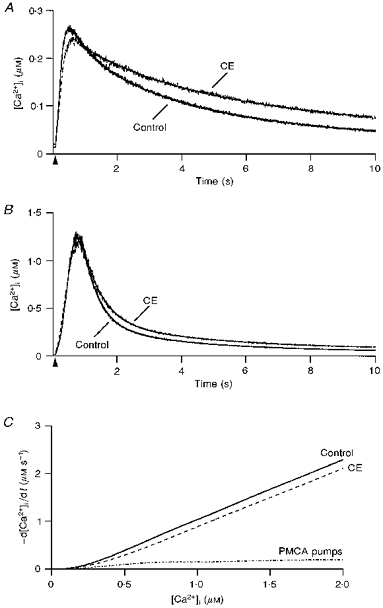
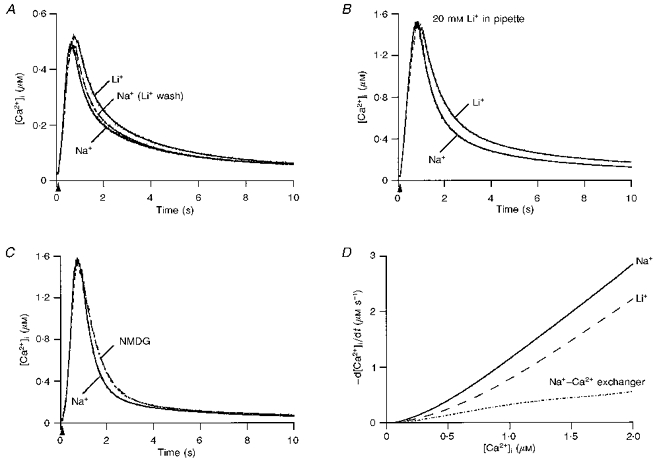
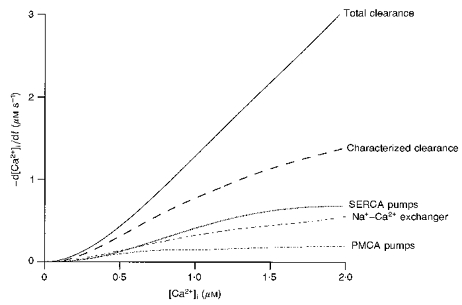
1. The mechanisms governing the return of intracellular calcium (Cai2+) to baseline levels following depolarization-evoked [Ca2+]i rises were investigated in Purkinje cell somata using tight-seal whole-cell recordings and fura-2 microfluorometry, for peak [Ca2+]i ranging from 50 nm to 2 microM. 2. Cai2+ decay was well fitted by a double exponential with time constants of O.6 and 3 s. Both time constants were independent of peak [Ca2+]i but the contribution of the faster component increased with [Ca2+]i. 3. Thapsigargin (10 microM) and cyclopiazonic acid (50 microM) prolonged Cai2+ decay indicating that sarco-endoplasmic reticulum Ca2+ (SERCA) pumps contribute to Purkinje cell Cai2+ clearance. 4. A modest participation in clearance was found for the plasma membrane Ca2+ (PMCA) pumps using 5,6-succinimidyl carboxyeosin (40 microM). 5. The Na(+)-Ca2+ exchanger also contributed to the clearance process, since replacement of extracellular Na+ by Li+ slowed Cai2+ decay. 6. Carbonyl cyanide m-chlorophenylhydrazone (CCCP, 2 microM) and rotenone (10 microM) increased [Ca2+]i and elicited large inward currents at -60 mV. Both effects were also obtained with CCCP in the absence of external Ca2+, suggesting that mitochondrial Ca2+ uptake uncouplers release Ca2+ from intracellular stores and may alter the membrane permeability to Ca2+. These effects were irreversible and impeded tests on the role of mitochondria in Cai2+ clearance. 7. The relative contribution of the clearance systems characterized in this study varied as a function of [Ca2+]i. At 0.5 microM Cai2+, SERCA pumps and the Na(+)-Ca2+ exchanger contribute equally to removal and account for 78% of the process. Only 45% of the removal at 2 microM Cai2+ can be explained by these systems. In this high [Ca2+]i range the major contribution is that of SERCA pumps (21%) and of the Na(+)-Ca2+ exchanger (18%), whereas the contribution of PMCA pumps is only 6%.


Figures

Figure 6
Figure 6. Effects of mitochondrial Ca2+ uptake uncouplers on Purkinje cells
A, plot of the resting calcium concentration, [Ca2+]R, (upper panel) and of the holding current at a potential of −60 mV (lower panel) as a function of WCR time. CCCP (2 μM), added to the bath solution during the time indicated by the bar, provoked an increase in [Ca2+]R and the development of an inward current. B, similar experiment, from a different cell, exposed to 10 μM rotenone and 4 μg ml−1 oligomycin, which also led to an increase in [Ca2+]R and the activation of an inward current. C, CCCP (2 μM) induced an increase in [Ca2+]R when the slice was bathed in a Ca2+-free solution, suggesting the presence of a CCCP-sensitive intracellular Ca2+ store in Purkinje cell somata. When extracellular Ca2+ was reintroduced to the bath solution while CCCP was present, there was an additional increase in [Ca2+]R. Points in time when depolarizations were applied are indicated by *; the last depolarization did not elicit any Cai2+ transient, confirming that external Ca2+ was effectively removed (see Methods). The transients elicited by depolarizing pulses are not included in the graph, which plots only the values of [Ca2+]R, as in A and B.
Figure 1
Figure 1. Decay of Cai2+ transients in cerebellar Purkinje cell somata
A, representative Cai2+ transients elicited by depolarizations of durations ranging from 50 to 300 ms (steps of 50 ms, as shown in lower part of inset). Double exponential fits of the decay phase are superimposed on each trace. An expanded view of the same data is displayed in the inset. In this and subsequent figures, the holding potential was set to −60 mV and the pulse brought the membrane potential to 0 mV. B, pooled data (10 cells) for the value of the time constants of the decay of Cai2+ transients (τ1 and τ2) as a function of peak [Ca2+]i ([Ca2+]peak). C, plot of the ratio of the corresponding amplitude coefficients (A1/A2) as a function of peak [Ca2+]i for the same cells as in B.
Figure 2
Figure 2. Stability of Cai2+ transients in WCR
A, Cai2+ transients elicited in 2 Purkinje cells by 100 ms depolarizations. The cells were dialysed with 25 and 250 μM fura-2, as indicated on the graph. B, pooled data for the mean t0.5 for Cai2+ transients, elicited by depolarizations ranging in duration from 20 to 300 ms, in cells dialysed with 25 μM fura-2 (•; 11 cells) or 250 μM fura-2 (^; 14 cells). t0.5 values in each cell were binned at increments of 100 nM peak [Ca2+]i. C, upper panel, 2 Cai2+ transients with peak levels in the 300 nM range were elicited by 175 ms depolarizations at the indicated WCR times. Lower panel, similar experiment with a different cell using 250 ms depolarizations, which elicit Cai2+ transients with peak values close to 1 μM. D, pooled data for the mean t0.5 as a function of time in WCR (10 cells). For each cell, the t0.5 values at different WCR times were normalized to the t0.5 at 4 min in WCR. Normalized data were binned in 2 min increments. In B and D, symbols display the mean and error bars the s.d.
Figure 3
Figure 3. Contribution of SERCA pumps to Cai2+ clearance
A, effect of cyclopiazonic acid (CPA) on small Cai2+ transients: superimposed Cai2+ transients recorded in control external saline and in the presence of 50 μM CPA. The control trace was elicited by a 60 ms depolarization at 9 min in WCR and the CPA trace by a 50 ms depolarization at 21 min WCR. The corresponding t0.5 values were 2.2 and 5.2 s, respectively. Superimposed on both traces are the fits of the decay phase by a single exponential, with t = 2.88 s in control and 6.63 s in CPA. B, effect of 50 μM CPA on large Cai2+ transients: the control trace corresponds to a 220 ms depolarization at 13 min in WCR while the CPA trace was elicited by a 200 ms depolarization at 28 min in WCR. The t0.5 values were 0.5 and 0.8 s, respectively. The fit of the decay by a double exponential is superimposed on each trace; τ1 and τ2 were 0.52 and 3.56 s in control, and 0.76 and 4.34 s in CPA. C, effect of 10 μM thapsigargin on Cai2+ transients. The control trace was elicited by a 100 ms depolarization at 10.5 min in WCR while the thapsigargin trace results from a 80 ms depolarization at 28 min in WCR. The corresponding t0.5 values were 1.6 and 3.6 s, respectively. Fits by a double exponential (superimposed on each trace) yield τ1 and τ2 values of 0.69 and 4.07 s in control, and 1.04 and 5.29 s in thapsigargin. D, data from 36 Cai2+ transients (18 in control saline and 18 in CPA) were pooled from 7 cells and analysed in terms of -d[Ca2+]i/dt as a function of [Ca2+]i. The symbols correspond to the data points and the lines to the fit of the pooled data. The inset illustrates polynomial fits and the resulting subtraction for the low [Ca2+]i range.
Figure 4
Figure 4. Contribution of PMCA pumps to Cai2+ clearance
A, effect of 5,6-succinimidyl carboxyeosin (CE) on small Cai2+ transients: superimposed Cai2+ transients recorded in control external saline and in the presence of 40 μM CE. The control trace was elicited by a 160 ms depolarization at 13 min in WCR and the CE trace results from a 150 ms depolarization at 25 min in WCR. The corresponding t0.5 values were 2.2 and 3.6 s. Superimposed on each trace are the fits of the decay by a double exponential, with τ1 and τ2 of 0.78 and 4.06 s in control, and 2.68 and 8.4 s in CE. B, effect of 40 μM CE on large Cai2+ transients: the control trace corresponds to a 210 ms depolarization at 11.5 min in WCR while the CE trace was elicited by a 200 ms depolarization at 25 min in WCR. The t0.5 values were 0.55 and 0.66 s, respectively. Time constants of decay (fits are superimposed on each trace) were 0.63 and 4.31 s in control, and 0.53 and 3.57 s in CE. C, data from 48 Cai2+ transients (24 in control saline and 24 in CE) were pooled from 13 cells and analysed in terms of -d[Ca2+]i/dt as a function of [Ca2+]i.
Figure 5
Figure 5. Contribution of the Na+–Ca2+ exchanger to Cai2+ clearance
A, 3 superimposed Ca2+ transients recorded from the same cell in control external saline (Na+), after changing the bath to a Li+ saline (Li+) and upon reintroduction of control saline (Na+ (Li+ wash)). The pulse duration and WCR times were: 250 ms and 7 min, respectively, for the Na+ trace; 275 ms and 12 min, respectively, for the Li+ trace; and 250 ms and 17 min, respectively, for the Na+ (Li+ wash) trace. The corresponding t0.5 values were 0.82, 1.05 and 0.89 s, respectively. The fits of the decay by a double exponential are superimposed on each trace; τ1 and τ2 were 0.49 and 3.10 s in control, 0.60 and 3.37 s in Li+, and 0.48 and 2.75 s upon return to Na+. B, 2 superimposed Cai2+ transients recorded before (Na+ trace) and after replacement of external Na+ by Li+ (Li+ trace) from a cell in which 20 mM Li+ was included in the patch pipette. Both transients were elicited by a 150 ms depolarization. WCR times, 9.3 min (Na+ trace) and 15 min (Li+ trace); t0.5 values, 0.67 and 1.0 s. Double exponential fits of the decay give τ1 and τ2 values of 0.61 and 3.42 s in control, and 0.8 and 4.16 s in Li+. C, effect of external Na+ replacement by NMDG: Cai2+ transients elicited by 180 ms depolarizations in control external saline (Na+ trace; 7 min in WCR) and in NMDG saline (NMDG trace; 12.5 min in WCR). The corresponding t0.5 values were 0.54 and 0.71 s. Time constants of decay were 0.48 and 3.76 s in control, and 0.70 and 3.86 s in NMDG. D, 36 Ca2+ transients from 15 cells, 18 for each condition (control and external Li+) were analysed to calculate -d[Ca2+]i/dt as a function of [Ca2+]i.
Figure 7
Figure 7. Summary of Cai2+ clearance in rat cerebellar Purkinje cell somata
Total Ca2+ clearance rate is presented in comparison with the rate of the different components characterized during the present study. Clearance rate is plotted as a function of the [Ca2+]i in the range between 50 nM and 2 μM.

Similar articles

Cited by

References

    1. Airaksinen MS, Eilers J, Garaschuk O, Thoenen H, Konnerth A, Meyer M. Ataxia and altered dendritic calcium signaling in mice carrying a targeted null mutation of the calbindin D28k gene. Proceedings of the National Academy of Sciences of the USA. 1997;94:1488–1493. 10.1073/pnas.94.4.1488. - DOI - PMC - PubMed
    1. Bassani RA, Bassani JW, Bers DM. Relaxation in ferret ventricular myocytes: role of the sarcolemmal Ca ATPase. Pflügers Archiv. 1995;430:573–578. - PubMed
    1. Bleakman D, Roback JD, Wainer BH, Miller RJ, Harrison NL. Calcium homeostasis in rat septal neurons in tissue culture. Brain Research. 1993;600:257–267. - PubMed
    1. Chard P, Bleakman D, Christakos S, Fullmer CS, Miller RJ. Calcium buffering properties of calbindin D28k and parvalbumin in rat sensory neurones. The Journal of Physiology. 1993;472:341–357. - PMC - PubMed
    1. Denk W, Sugimori M, Llinás R. Two types of calcium response limited to single spines in cerebellar Purkinje cells. Proceedings of the National Academy of Sciences of the USA. 1995;92:8279–8282. - PMC - PubMed

Publication types

MeSH terms

LinkOut - more resources