. 1998 Sep 1;511 ( Pt 2)(Pt 2):333-46.
doi: 10.1111/j.1469-7793.1998.333bh.x.

Modulation of human erg K+ channel gating by activation of a G protein-coupled receptor and protein kinase C

Affiliations

Modulation of human erg K+ channel gating by activation of a G protein-coupled receptor and protein kinase C

F Barros et al. J Physiol. .

Abstract

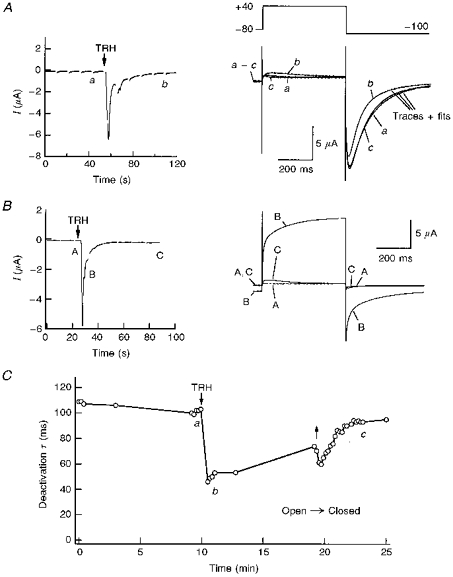
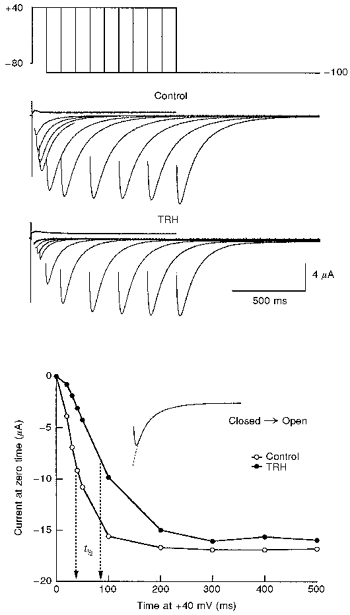
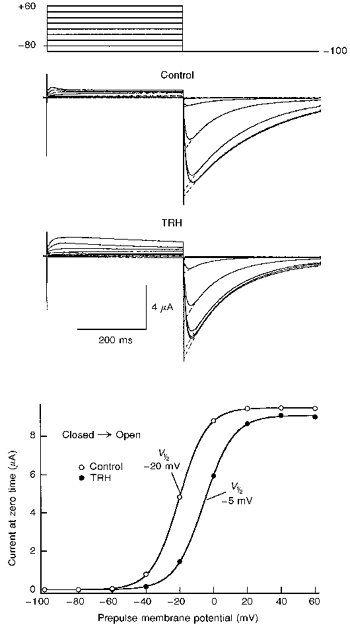
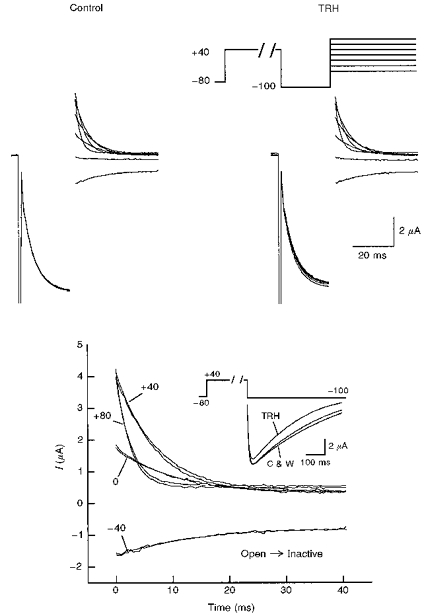
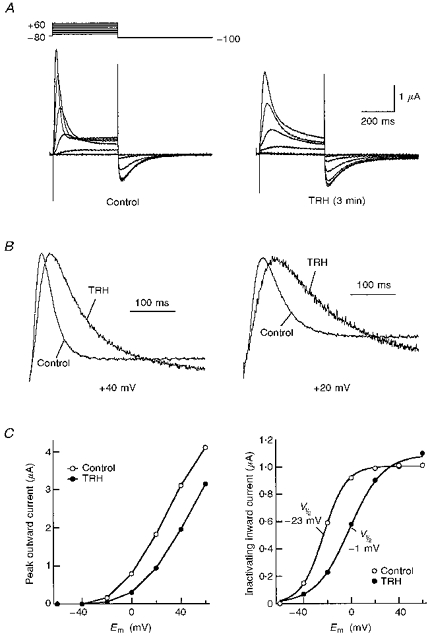
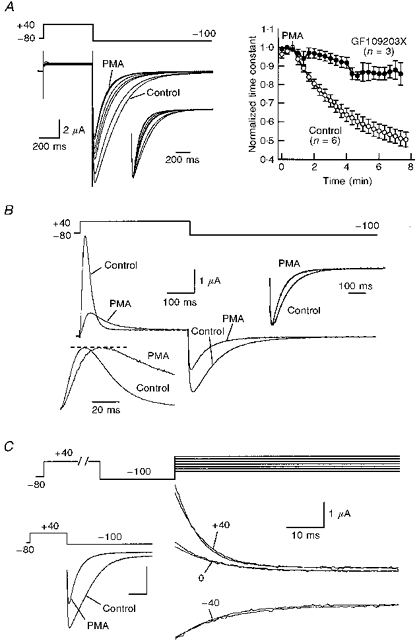
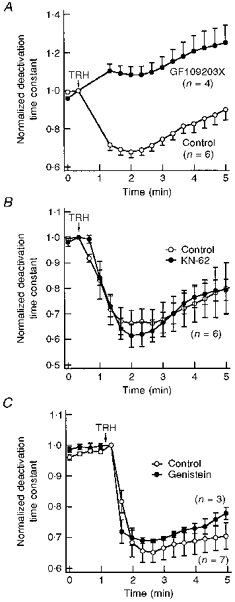
1. Modulation of the human ether-à-go-go-related gene (HERG) K+ channel was studied in two-electrode voltage-clamped Xenopus oocytes co-expressing the channel protein and the thyrotropin-releasing hormone (TRH) receptor. 2. Addition of TRH caused clear modifications of HERG channel gating kinetics. These variations consisted of an acceleration of deactivation, as shown by a faster decay of hyperpolarization-induced tail currents, and a slower time course of activation, measured using an envelope of tails protocol. The voltage dependence for activation was also shifted by nearly 20 mV in the depolarizing direction. Neither the inactivation nor the inactivation recovery rates were altered by TRH. 3. The alterations in activation gating parameters induced by TRH were demonstrated in a direct way by looking at the increased outward K+ currents elicited in extracellular solutions in which K+ was replaced by Cs+. 4. The effects of TRH were mimicked by direct pharmacological activation of protein kinase C (PKC) with beta-phorbol 12-myristate, 13-acetate (PMA). The TRH-induced effects were antagonized by GF109203X, a highly specific inhibitor of PKC that also abolished the PMA-dependent regulation of the channels. 5. It is concluded that a PKC-dependent pathway links G protein-coupled receptors that activate phospholipase C to modulation of HERG channel gating. This provides a mechanism for the physiological regulation of cardiac function by phospholipase C-activating receptors, and for modulation of adenohypophysial neurosecretion in response to TRH.


Figures

Figure 1
Figure 1. Effect of TRH-R activation on HERG tail current kinetics
A, left, inward Ca2+-dependent Cl currents in response to TRH. Representative inward Cl currents in a voltage-clamped oocyte 2 days after co-injection of TRH-R and HERG channel cRNA are shown. The start of perfusion with high-K+ OR-2 plus 1 μM TRH is indicated. The current trace represents continuous segments obtained at −80 mV. The gaps on the trace indicate times at which a depolarization pulse was applied according to the voltage pulse diagram shown on the right. Right, membrane currents elicited by membrane depolarization at different times before (trace a) and after challenging the cell with TRH (traces b and c). Depolarization steps of 400 ms from −80 to +40 mV were delivered to the oocyte every 10 s, followed by a 400 ms repolarization to −100 mV. Membrane currents shown correspond to pulses delivered either 10 s before TRH addition (trace a), or 50 s after starting perfusion with 1 μM TRH (trace b), respectively. A current trace elicited with an identical protocol after 6 min of TRH washout (trace c) is also shown to illustrate the reversibility of the TRH effect. The TRH application lasted for about 9 min. Bi-exponential fits superimposed to the current traces are shown for −100 mV tails. Note the correspondence of current kinetics along the tail rising phase for control and TRH traces. B, left, inward Ca2+-dependent Cl currents obtained in an oocyte injected with TRH-R cRNA but not with HERG channel messages. Right, membrane currents elicited by membrane depolarizations at the times marked A to C on the left. Identical conditions to those indicated in A were used. Note the fast monoexponential decay of the Cl tail currents and their small magnitude 1 min after start of the TRH addition. C, time course of deactivation time constant variations in response to TRH. The time constant was quantified by fitting a double exponential to the tail as shown in A (right). Subsequently, the plotted deactivation time constant and the time constant for inactivation recovery were obtained from the decaying portion and the initial rising phase of the tail, respectively. The periods without data points correspond to times at which I-V curves were generated. Time constant values for the two pulses following introduction of TRH in the chamber, corresponding to periods of huge increases in inward Cl currents, have not been included in the graph. Start of perfusion with 1 μM TRH and hormone washout is signalled by arrows. a-c correspond to the experimental times at which current traces marked with the same lettering in A were obtained.
Figure 2
Figure 2. Effect of TRH on HERG channel activation kinetics
The time course of voltage-dependent activation was studied in the absence (control) or the presence of 1 μM TRH by varying the duration of a depolarizing prepulse to +40 mV according to the voltage protocol shown at the top. Test pulses were applied once every 20 s. For TRH, data collection started 2 min after challenging the cell with the neuropeptide. The magnitude of the instantaneous tail current at −100 mV was determined by fitting an exponential to the decaying portion of the tail as shown in the inset of the lower panel, and extrapolating the current to the moment the depolarizing pulse was ended. Capacitive transients have been blanked for clarity. Note the sigmoidal activation kinetics and the shift in the time necessary to attain a half-maximal current magnitude. For further explanation, see text.
Figure 3
Figure 3. Effect of TRH on HERG channel voltage dependence of activation
Voltage dependence of activation was studied in the absence (control) or the presence of 1 μM TRH by varying the magnitude of a 400 ms prepulse according to the voltage protocol shown at the top. Test pulses were applied once every 20 s. When the effect of TRH was tested, data collection started 2 min after challenging the cell with the neuropeptide. The magnitude of the instantaneous tail current at −100 mV was determined by fitting an exponential to the decaying portion of the tail as shown superimposed on the tail currents, and extrapolating the current to the moment the depolarizing pulse was ended. The continuous lines in the lower panel correspond to Boltzmann curves: h (V) =Imax (1/(1 + exp (V - V½)/k)), which best fitted to the data with V½ of −20 and −5 mV, Imax of 9.4 and 9.1 μA, and k values of −8.1 and −8.7 for control and TRH, respectively.
Figure 4
Figure 4. Lack of TRH effects on HERG channel inactivation kinetics
Onset of fast inactivation was studied using the voltage protocol shown at the top. HERG was activated and inactivated with a 400 ms prepulse to +40 mV. A 20 ms pulse to −100 mV was used to recover the channels from inactivation, followed by a test pulse to different voltages to re-inactivate the channels. Test pulses were applied once every 20 s. The decaying portion of the current during the test pulse is shown starting 2.5 ms after the hyperpolarizing pulse to −100 mV was ended. Membrane currents recorded at the end of the depolarization prepulse and along the 20 ms hyperpolarization pulse are also shown. The two families of current traces shown at the top were obtained in the absence (control) or starting 2 min after challenging the cell with 1 μM TRH. Inactivating decaying currents along the test pulses to −40, 0, +40 and +80 mV both in the absence or in the presence of TRH are shown superimposed in the lower panel. Note the almost exact correspondence of both currents at all tested voltages. TRH effects on inactivation kinetics were not observed even though the hormone induced a clear acceleration of the deactivation rate in the same oocyte, as shown in the inset. In this case, inward tail currents during long hyperpolarizations to −100 mV are shown. Currents were recorded either before (C), 90 s after start the TRH treatment (TRH), or after 10 min of hormone washout (W).
Figure 5
Figure 5. Effect of TRH on activation gating of HERG channels in Cs+-containing extracellular solutions
A, comparison of membrane currents elicited by membrane depolarization before (control) or 3 min after starting the treatment with 1 μM TRH (TRH). Pulses (400 ms) were applied to test potentials of −60 to +60 mV in 20 mV steps from a holding potential of −80 mV. Test pulses were applied once every 20 s. Current traces shown have been subtracted for leak. Extracellular solutions containing Cs+ instead of K+ were used. B, slower activation rates are induced by TRH on outward K+currents studied in Cs+-containing extracellular solutions. Outward currents obtained in the absence (control) or the presence of TRH are shown for depolarizing pulses to +40 (left) or +20 mV (right). For comparison, currents were normalized to peak. C, left, effect of TRH on the magnitude of outward currents as a function of membrane potential. Outward current magnitudes at the peak are plotted vs. test pulse potential (Em) for the currents shown in A. The data points are connected by straight lines. Right, effect of TRH on the magnitude of Cs+ inward tail currents as a function of membrane potential. The magnitude of the tail currents is plotted vs. test pulse potential for the currents shown in A. The continuous lines correspond to Boltzmann curves that best fitted the data with V½ of −23 and −1 mV, Imax of 1.0 and 1.1 μA, and k values of −9.5 and −14.2 for control and TRH, respectively.
Figure 6
Figure 6. Effect of PMA on HERG channel kinetics
A, acceleration of deactivation rates in response to PMA. Superimposed current traces in response to the indicated potential protocol are shown on the left. Test pulses were delivered once every 20 s to an oocyte bathed in extracellular high-K+ medium. Only traces obtained before (control) and every minute after the start of 100 nM PMA addition are shown. Tail currents normalized to peak are shown in the inset for a better comparison of current kinetics. Note the correspondence of the initial rising phase of the tails. Averaged values of deactivation time constants for 6 control oocytes and 3 oocytes preincubated with 10 μM GF109203X for 2–3 h from the same donor are shown on the right. Similar results were obtained in 4 additional experiments with control oocytes (19 oocytes from 5 frogs) and 2 additional experiments with oocytes treated with GF109203X (11 oocytes from 3 frogs). Time constants were normalized to that measured at the time of PMA addition. B, slow-down of outward HERG current kinetics by PMA in Cs+-containing extracellular solutions. Membrane currents obtained with the voltage protocol shown at the top in the absence (control) or 5 min after addition of 100 nM PMA are shown superimposed. Outward currents normalized to peak are shown in the inset on the lower left for comparison. Normalized tail currents are also shown (inset, upper right). C, lack of PMA effect on HERG channel inactivation kinetics. Onset of fast inactivation was studied using an oocyte bathed in extracellular high-K+ medium, using the double-pulse protocol shown at the top (see legend to Fig. 5). Inactivating decaying currents along the test pulses to −40, 0 and +40 mV are shown both in the absence or presence of 100 nM PMA for 10 min. Note that currents in both conditions are practically indistinguishable. However, a clear effect of PMA on deactivation rates was observed in the same oocyte, as shown by a marked acceleration of hyperpolarization-induced tail current decay (inset, lower left corner).
Figure 7
Figure 7. Effect of different protein kinase inhibitors on TRH-induced modification of HERG deactivation kinetics
A, blockade of the TRH effect by the PKC inhibitor GF109203X. Deactivation time constants normalized to that measured at the moment of TRH addition are shown for untreated oocytes (control) or oocytes incubated for 4–6 h with 10 μM GF109203X. Test pulses were delivered to the cells every 20 s. Time constant values for the two pulses following introduction of TRH into the chamber have been deleted for clarity. The start of a 30 s perfusion with medium containing 1 μM TRH is indicated. B, TRH-induced effects in the presence of the Ca2+-calmodulin protein kinase II inhibitor KN-62. Variations in the deactivation time constant for untreated oocytes (control) and oocytes incubated for 1–3 h with 20 μM KN-62 are shown. The start of a 30 s perfusion with medium containing 1 μM TRH is indicated at the top of the graph. C, TRH-induced effects in the presence of the tyrosine kinase inhibitor genistein. Normalized deactivation time constant values are shown for oocytes injected with a micropipette filled with 100 μM genistein (final intracellular concentration approximately 5 μM genistein) or vehicle (control) 30 min before start of HERG current recordings. The start of perfusion with 1 μM TRH is indicated. In this case, the hormone remained present up to the end of the experiments.

References

    1. Arcangeli A, Becchetti A, Mannini A, Mugnai G, De Filippi P, Tarone G, Del Bene MR, Barletta E, Wanke E, Olivotto M. Integrin-mediated neurite outgrowth in neuroblastoma cells depends on the activation of potassium channels. Journal of Cell Biology. 1993;122:1131–1143. 10.1083/jcb.122.5.1131. - DOI - PMC - PubMed
    1. Arcangeli A, Bianchi L, Becchetti A, Faravelli L, Coronnello M, Mini E, Olivotto M, Wanke E. A novel inward-rectifying K+ current with a cell-cycle dependence governs the resting potential of mammalian neuroblastoma cells. The Journal of Physiology. 1995;489:455–471. - PMC - PubMed
    1. Barhanin J, Lesage F, Guillemare E, Fink M, Lazdunski M, Romey G. KvLQT1 and IsK (minK) proteins associate to form the IKs cardiac potassium current. Nature. 1996;384:78–80. - PubMed
    1. Barros F, del Camino D, Pardo LA, Palomero T, Giráldez T, de la Peña P. Demonstration of an inwardly rectifying K+ current component modulated by thyrotropin-releasing hormone and caffeine in GH3 rat anterior pituitary cells. Pflügers Archiv. 1997;435:119–129. - PubMed
    1. Barros F, Delgado LM, Del Camino D, de la Peña P. Characteristics and modulation by thyrotropin-releasing hormone of an inwardly rectifying K+ current in patch-perforated GH3 anterior pituitary cells. Pflügers Archiv. 1992;422:31–39. - PubMed

MeSH terms

LinkOut - more resources