

Chemosensitivity of rat medullary raphe neurones in primary tissue culture
- PMID: 9706021
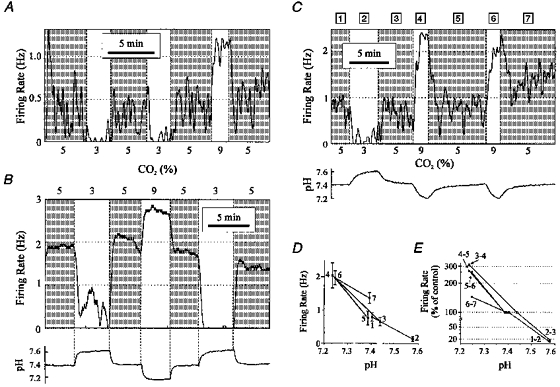
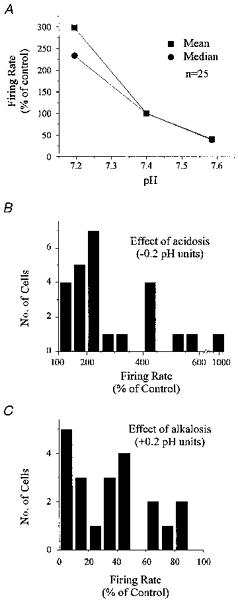
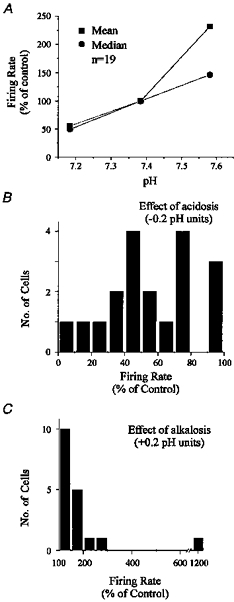
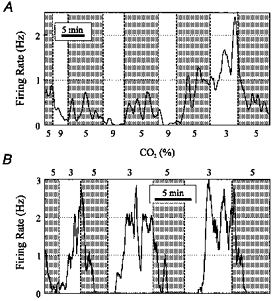
- PMCID: PMC2231124
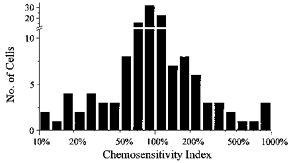
- DOI: 10.1111/j.1469-7793.1998.433bh.x
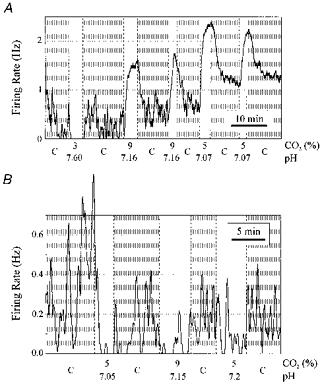
Chemosensitivity of rat medullary raphe neurones in primary tissue culture
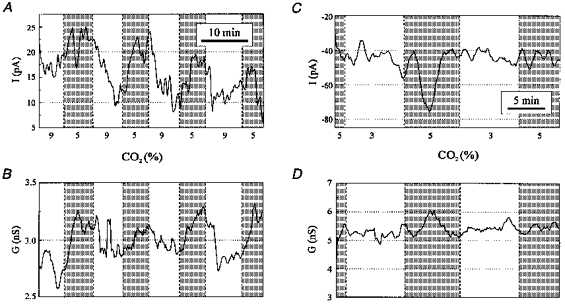
Abstract
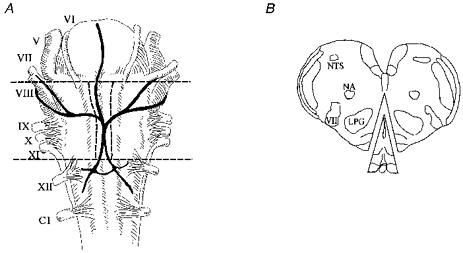
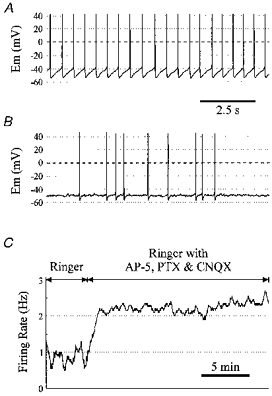
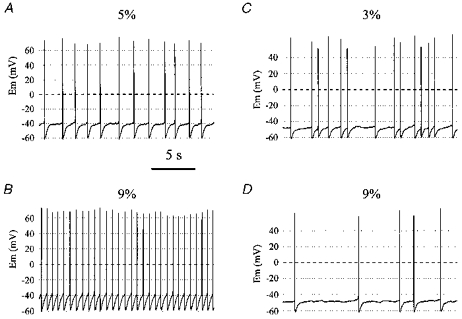
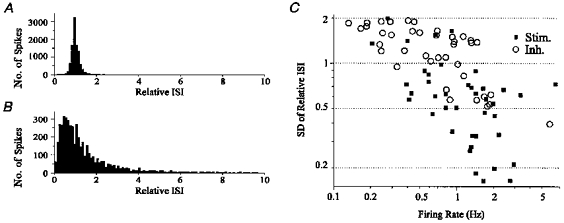
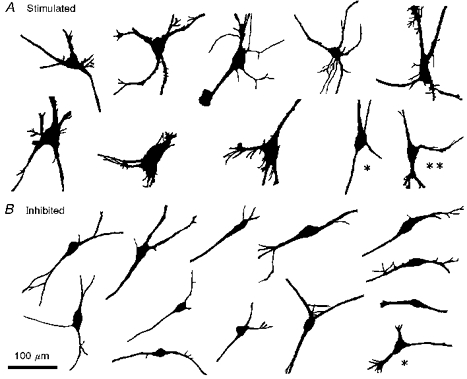
1. The medullary raphe, within the ventromedial medulla (VMM), contains putative central respiratory chemoreceptors. To study the mechanisms of chemosensitivity in the raphe, rat VMM neurones were maintained in primary dissociated tissue culture, and studied using perforated patch-clamp recordings. Baseline electrophysiological properties were similar to raphe neurones in brain slices and in vivo. 2. Neurones were exposed to changes in CO2 from 5% to 3 or 9% while maintaining a constant [NaHCO3]. Fifty-one per cent of neurones (n = 210) did not change their firing rate by more than 20% in response to hypercapnic acidosis. However, 22% of neurones responded to 9% CO2 with an increase in firing rate ('stimulated'), and 27% of neurones responded with a decrease in firing rate ('inhibited'). 3. Chemosensitivity has often been considered an all-or-none property. Instead, a method was developed to quantify the degree of chemosensitivity. Stimulated neurones had a mean increase in firing rate to 298 +/- 215% of control when pH decreased from 7.40 to 7.19. Inhibited neurones had a mean increase in firing rate to 232 +/- 265% of control when pH increased from 7. 38 to 7.57. 4. Neurones were also exposed to isocapnic acidosis. All CO2-stimulated neurones tested (n = 15) were also stimulated by isocapnic acidosis, and all CO2-inhibited neurones tested (n = 19) were inhibited by isocapnic acidosis. Neurones with no response to hypercapnic acidosis also had no response to isocapnic acidosis (n = 12). Thus, the effects of CO2 on these neurones were mediated in part via changes in pH. 5. In stimulated neurones, acidosis induced a small increase in the after-hyperpolarization level of 1.38 +/- 1. 15 mV per -0.2 pH units, which was dependent on the level of tonic depolarizing current injection. In voltage clamp mode at a holding potential near resting potential, there were small and inconsistent changes in whole-cell conductance and holding current in both stimulated and inhibited neurones. These results suggest that pH modulates a conductance in stimulated neurones that is activated during repetitive firing, with a reversal potential close to resting potential. 6. The two subtypes of chemosensitive VMM neurones could be distinguished by characteristics other than their response to acidosis. Stimulated neurones had a large multipolar soma, whereas inhibited neurones had a small fusiform soma. Stimulated neurones were more likely than inhibited neurones to fire with the highly regular pattern typical of serotonergic raphe neurones in vivo. 7. Within the medullary raphe, chemosensitivity is a specialization of two distinct neuronal phenotypes. The response of these neurones to physiologically relevant changes in pH is of the magnitude that suggests that this chemosensitivity plays a functional role. Elucidating their mechanisms in vitro may help to define the cellular mechanisms of central chemoreception in vivo.
Figures
Similar articles
-
Quantification of the response of rat medullary raphe neurones to independent changes in pH(o) and P(CO2).J Physiol. 2002 May 1;540(Pt 3):951-70. doi: 10.1113/jphysiol.2001.013443. J Physiol. 2002. PMID: 11986382 Free PMC article.
-
Chemosensitivity of non-respiratory rat CNS neurons in tissue culture.Brain Res. 2000 Mar 31;860(1-2):119-29. doi: 10.1016/s0006-8993(00)02033-3. Brain Res. 2000. PMID: 10727630
-
Development of chemosensitivity of rat medullary raphe neurons.Neuroscience. 1999 Mar;90(3):1001-11. doi: 10.1016/s0306-4522(98)00505-3. Neuroscience. 1999. PMID: 10218799
-
Chemosensitivity of serotonergic neurons in the rostral ventral medulla.Respir Physiol. 2001 Dec;129(1-2):175-89. doi: 10.1016/s0034-5687(01)00289-4. Respir Physiol. 2001. PMID: 11738653 Review.
-
Medullary serotonin neurons and central CO2 chemoreception.Respir Physiol Neurobiol. 2009 Aug 31;168(1-2):49-58. doi: 10.1016/j.resp.2009.04.014. Epub 2009 Apr 24. Respir Physiol Neurobiol. 2009. PMID: 19394450 Free PMC article. Review.
Cited by
-
Functional connectivity in raphé-pontomedullary circuits supports active suppression of breathing during hypocapnic apnea.J Neurophysiol. 2015 Oct;114(4):2162-86. doi: 10.1152/jn.00608.2015. Epub 2015 Jul 22. J Neurophysiol. 2015. PMID: 26203111 Free PMC article.
-
Isoflurane abolishes spontaneous firing of serotonin neurons and masks their pH/CO₂ chemosensitivity.J Neurophysiol. 2015 Apr 1;113(7):2879-88. doi: 10.1152/jn.01073.2014. Epub 2015 Feb 18. J Neurophysiol. 2015. PMID: 25695656 Free PMC article.
-
Role of intracellular and extracellular pH in the chemosensitive response of rat locus coeruleus neurones.J Physiol. 2002 Jun 1;541(Pt 2):493-509. doi: 10.1113/jphysiol.2001.014142. J Physiol. 2002. PMID: 12042354 Free PMC article.
-
The integrated brain network that controls respiration.Elife. 2023 Mar 8;12:e83654. doi: 10.7554/eLife.83654. Elife. 2023. PMID: 36884287 Free PMC article. Review.
-
Central serotonin neurons are required for arousal to CO2.Proc Natl Acad Sci U S A. 2010 Sep 14;107(37):16354-9. doi: 10.1073/pnas.1004587107. Epub 2010 Aug 30. Proc Natl Acad Sci U S A. 2010. PMID: 20805497 Free PMC article.
References
-
- Aghajanian GK. Modulation of a transient outward current in serotonergic neurons by α1-adrenoceptors. Nature. 1985;315:501–503. - PubMed
-
- Banker G, Goslin K. Culturing Nerve Cells. Cambridge, MA, USA: MIT Press; 1991.
-
- Bayliss DA, Li YW, Talley EM. Effects of serotonin on caudal raphe neurons: inhibition of N- and P/Q-type calcium channels and the afterhyperpolarization. Journal of Neurophysiology. 1997;77:1362–1374. - PubMed
-
- Bernard DG, Li A, Nattie EE. Evidence for central chemoreception in the midline raphe. Journal of Applied Physiology. 1996;80:108–115. - PubMed
-
- Bonvento G, Lacombe P, Mackenzie ET, Fage D, Benavides J, Rouquier L, Scatton B. Evidence for differing origins of the serotonergic innervation of major cerebral arteries and small pial vessels in the rat. Journal of Neurochemistry. 1991;56:681–689. - PubMed
Publication types
MeSH terms
Substances
Grants and funding
LinkOut - more resources
Full Text Sources