. 1998 Sep 1;511 ( Pt 2)(Pt 2):479-94.
doi: 10.1111/j.1469-7793.1998.479bh.x.

Field sensitivity action spectra of cone photoreceptors in the turtle retina

Affiliations

Field sensitivity action spectra of cone photoreceptors in the turtle retina

I Perlman et al. J Physiol. .

Abstract

1. The Stiles two-colour increment threshold technique was applied to turtle cone photoreceptors in order to derive their field sensitivity action spectra. 2. Photoresponses of cone photoreceptors were recorded intracellularly. Flash sensitivities were calculated from small amplitude (< 1 mV) responses. The desensitizing effects of backgrounds of different wavelengths were measured and the background irradiance needed to desensitize the cone by a factor of 10 (1 log unit) was defined as threshold. The reciprocals of these thresholds were used to construct the field sensitivity action spectrum. 3. The field sensitivity action spectra of long-wavelength-sensitive (L) and medium-wavelength-sensitive (M) cones depended upon the wavelength of the test flash used to measure them. This excludes the possibility that turtle cones can function as single-colour mechanisms in the Stiles sense. 4. In fourteen L-cones, the average wavelength of peak sensitivity of the field sensitivity action spectrum was 613.7 +/- 7.7 nm for the 500 nm test and 635.6 +/- 9.6 nm for the 700 nm test. For six M-cones, these values were 558.5 +/- 6.8 and 628.8 +/- 10.6 nm for the 500 and 700 nm tests, respectively. 5. Two physiological mechanisms are suggested as contributing to the dependency of the field sensitivity action spectrum upon test wavelength. One is based upon the transmissivity properties of the coloured oil droplets, while the other hypothesizes excitatory interactions between cones of different spectral type. 6. Computer simulations of the field sensitivity action spectra indicate that both mechanisms are needed in order to account for the dependency of the field sensitivity action spectrum upon the wavelength of the test flash.


Figures

Figure 1
Figure 1. Stability of intracellular recordings of one L-cone
Dark-adapted flash sensitivities were measured with 700 and 500 nm test lights (• and ○, respectively) at different times throughout the experiment. The ratio between these two sensitivities (□) showed a slight decline with time. In this particular L-cone, intracellular recording was made for more than 2 h.
Figure 2
Figure 2. The desensitizing action of 700 and 560 nm background lights on an L-cone measured with two test wavelengths: 700 and 500 nm
For each background (b/g) irradiance, the sensitivity was normalized relative to the dark-adapted sensitivity as described in the Methods section. Log sensitivity losses by the 700 nm (circles) and 560 nm (squares) backgrounds are described for the 500 nm test (open symbols) and 700 nm test (filled symbols) in A and B, respectively. The same data are replotted as the desensitization of both test wavelengths by the 700 nm background (C) and by the 560 nm background (D). The data points were fitted by eye (dotted curves) to the Stiles ζ curve (Wyszecki & Stiles, 1982).
Figure 3
Figure 3. Field sensitivity action spectra of the L-cone of Fig. 2 measured with test wavelengths of 500 nm (left) and 700 nm (right)
These spectra were constructed from the reciprocals of the background irradiances needed to reduce the flash sensitivity to 500 and 700 nm stimuli by a factor of 10. The main band of each spectrum was fitted to a parabolic function (dotted curves) in order to obtain the wavelength of peak field sensitivity, μmax.
Figure 4
Figure 4. The desensitizing action of 700 nm (A) and 500 nm (B) background (b/g) lights on flash sensitivity of an M-cone measured with 700 and 500 nm tests (• and ○, respectively)
The dotted curves describe Stiles’ζ function that was fitted to the data points by eye.
Figure 5
Figure 5. Field sensitivity action spectra of the M-cone of Fig. 4 measured with test wavelengths of 500 nm (left) and 700 nm (right)
These spectra were constructed from the reciprocals of the background irradiances needed to reduce the flash sensitivity to 500 and 700 nm stimuli by a factor of 10. The main band of each spectrum was fitted to a parabolic function (dotted curves) in order to obtain the wavelength of peak field sensitivity, μmax.
Figure 6
Figure 6. Mean (±s.d.) field sensitivity data of twenty L-cones (A) and eight M-cones (B)
Before averaging, the field sensitivity data of each L-cone were normalized to the value obtained with 700 nm background using the 700 nm test, and the data of each M-cone were normalized to the field sensitivity measured with 500 nm background using the 500 nm test. The continuous curves are the action spectra of ‘the isolated M-cone’ and ‘the isolated L-cone’, derived experimentally from the eyecup of the turtle Mauremis caspica (Perlman et al. 1994).
Figure 7
Figure 7. Schematic illustration of optical and neuronal contributions to the photoresponses of turtle L- and M-cones
The incident light is divided into two major pathways (dashed lines). A fraction (a in L-cones and b in M-cones) bypasses the oil droplet and reaches the tip of the cone outer segment, while the rest of the light passes through the oil droplet and mainly excites the base of the outer segment. The light-induced voltage response of each cone is the summation of two contributions (continuous arrows); the major one reflecting the effects of photon absorption in the cone outer segments (R in L-cones and G in M-cones) and a smaller one originating in cones of different spectral type. A fraction p of the L-cone response is transmitted to the M-cone response, while a fraction q of the M-cone response is transmitted to the L-cone.
Figure 8
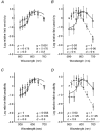
Figure 8. Testing the contribution of optical considerations alone to the field sensitivity action spectra of L-cones (A and C) and M-cones (B and D)
Experimental field sensitivity data, obtained with 700 and 500 nm tests (○ and ×, respectively) were redrawn from Fig. 6. Simulated spectra were calculated for 700 and 500 nm tests (continuous and dashed curves, respectively) using eqns (A6) and (A7). Two sets of parameters (a, b, c, d) were used for the simulation: one that best fitted the L-cone data (A and B) and the other that better fitted the M-cone data (C and D). The goodness of fit was judged by eye. The parameters for the L-cones (p, a, c) and for the M-cones (q, b, d) are listed.
Figure 9
Figure 9. Fitting the experimental field sensitivity data of L-cones (A and C) and M-cones (B and D) to simulated field sensitivity action spectra that were derived from the optical-neural interactions model
Experimental field sensitivity data, obtained with 700 and 500 nm tests (○ and ×, respectively) were redrawn from Fig. 6. Simulated spectra were calculated for 700 and 500 nm tests (continuous and dashed curves, respectively) using in combination with eqns (A6) and (A7). In A and B, different sets of parameters were chosen to obtain the best fit (as judged by eye) of the simulated field sensitivity action spectra to the L-cones and M-cones, respectively. In C and D, one set of parameters was used for both types of cones. The parameters for the L-cones (p, a, c) and for the M-cones (q, b, d) are listed.
Figure 10
Figure 10. The contributions of the oil droplets and optical pathways of incident light to the simulated field sensitivity action spectra of an L-cone (A, B, C) and an M-cone (D, E, F)
The spectra for the 700 and 500 nm tests (continuous and dashed curves, respectively) were derived by calculating the background irradiances needed to desensitize the cones by a factor of 10. Equations (A6) and (A7) were used to calculate the sensitivity (response for incident photon) of the L-cone and M-cone, respectively, assuming complete localization of excitation and adaptation (c =d = 0). In A and D, only a small fraction (a =b = 0.05) of the incident light bypasses the oil droplets, and most of it passes through the oil droplet. The reverse situation is shown in C and F, where most of the light bypasses the oil droplet (a =b = 0.95). The spectra in B and E represent the case where the incident light divides evenly between the two pathways (a =b = 0.5).
Figure 11
Figure 11
The degree to which the tip and base of the outer segments act as separate parts also affects the simulated field sensitivity action spectra as shown for an L-cone (A, B, C) and an M-cone (D, E, F)The spectra for the 700 and 500 nm tests (continuous and dashed curves, respectively) were derived using for the case in which 30 % of the incident light bypasses the oil droplets (a =b = 0.3). In A and D, the tip and the base of the outer segments are almost completely isolated (c =d = 0.05), while in C and F, these two parts behave almost like one unit (c =d = 0.95). The spectra in B and E represent an intermediate case (c =d = 0.5).

Similar articles

Cited by

References

    1. Baylor DA. Lateral interaction between vertebrate photoreceptors. Federation Proceedings. 1974;33:1074–1077. - PubMed
    1. Baylor DA, Hodgkin AL. Detection and resolution of visual stimuli by turtle photoreceptors. The Journal of Physiology. 1973;234:163–198. - PMC - PubMed
    1. Baylor DA, Hodgkin AL. Changes in time scale and sensitivity in turtle photoreceptors. The Journal of Physiology. 1974;242:729–758. - PMC - PubMed
    1. Baylor DA, Nunn BJ, Schnapf JL. Spectral sensitivity of cones of the monkey Macaca fascicularis. Journal of Physiology. 1987;390:145–160. - PMC - PubMed
    1. Burkhardt DA. Light adaptation and photopigment bleaching in cone photoreceptors in situ in the retina of the turtle. Journal of Neuroscience. 1994;14:1091–1105. - PMC - PubMed

Publication types

LinkOut - more resources