

Carbachol-induced oscillations in membrane potential and [Ca2+]i in guinea-pig ileal smooth muscle cells
- PMID: 9706031
- PMCID: PMC2231125
- DOI: 10.1111/j.1469-7793.1998.559bh.x
Carbachol-induced oscillations in membrane potential and [Ca2+]i in guinea-pig ileal smooth muscle cells
Abstract
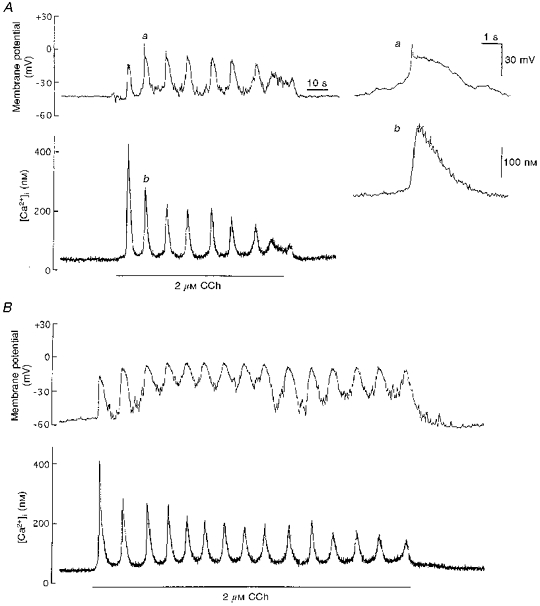
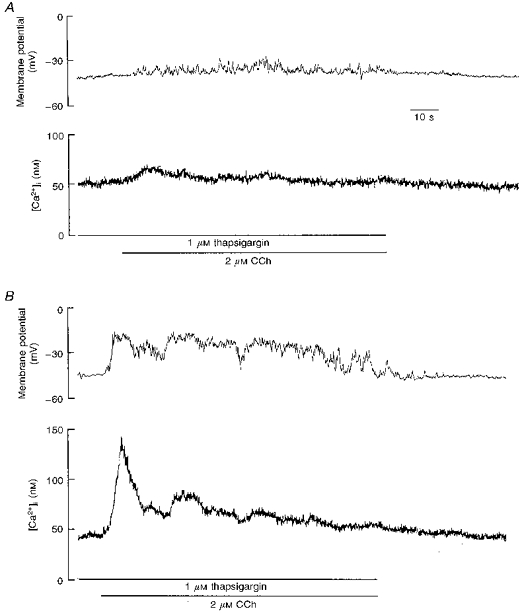
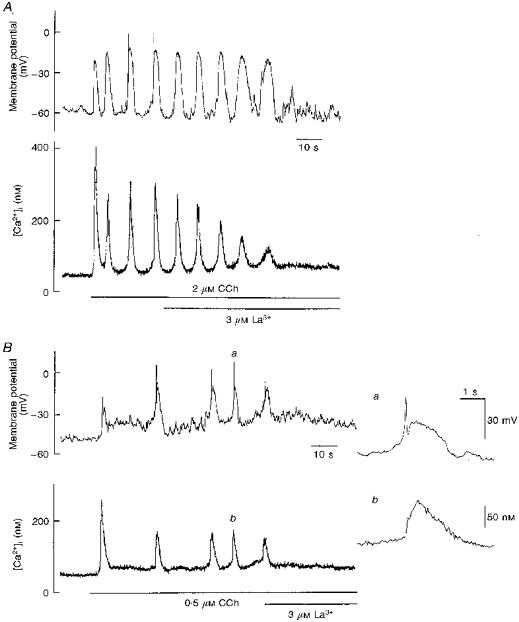
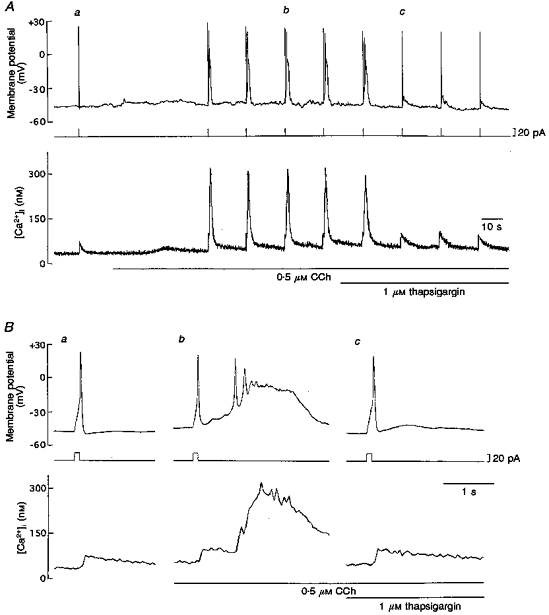
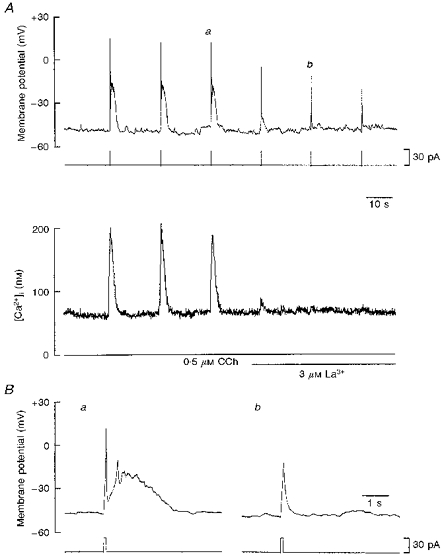
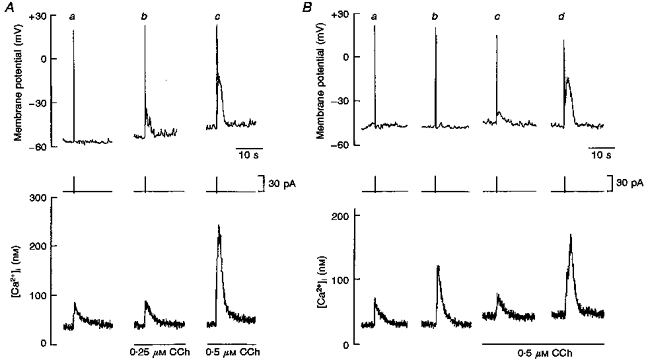
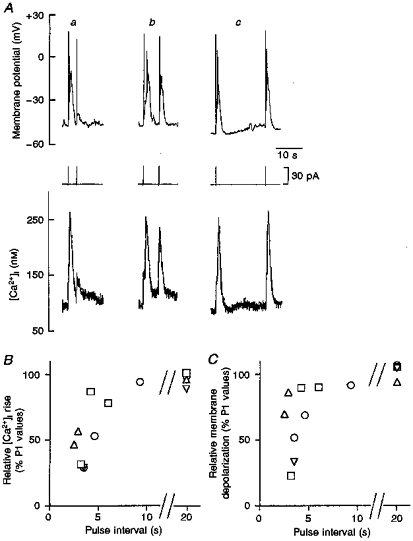
1. Cytosolic free Ca2+ concentration ([Ca2+]i) and membrane potential were simultaneously recorded from single smooth muscle cells of guinea-pig ileum, using a combination of nystatin-perforated patch clamp and fura-2 fluorimetry techniques. 2. Carbachol (CCh, 2 microM) produced oscillatory changes in [Ca2+]i and membrane potential which coincided well in time with each other, and peaks of membrane potential oscillations reached a saturated level of around -7 mV. Thapsigargin (1 microM) abolished these effects of 2 microM CCh. La3+ (3 microM) immediately prevented the discharge of spike potentials, but allowed both on-going oscillatory responses to persist for a while. 3. CCh (0.25-0.75 microM) caused membrane potential and [Ca2+]i to oscillate in some 20 % of cells studied. Every membrane potential oscillation was preceded by the discharge of single or multiple spike potentials. The effects of CCh were readily abolished by La3+ (3 microM). 4. In cells exhibiting no oscillatory response to 0.25-0.75 microM CCh, an electrically evoked action potential usually generated changes in [Ca2+]i and membrane potential similar to those following spontaneously evoked action potentials, and sometimes it did so only after [Ca2+]i or InsP3 had been slightly elevated by repeatedly evoking action potentials or by increasing CCh concentration in the bath medium. 5. The results suggest that in ileal smooth muscle cells, the oscillations of [Ca2+]i and membrane potential arising from muscarinic stimulation result from release of Ca2+ from internal stores and that there is a Ca2+-induced potentiation of coincidently elicited cation channel openings. Under weak muscarinic stimulation, Ca2+ entry upon action potential discharge can trigger such a release of stored Ca2+, resulting in synchronous generation of a large rise in [Ca2+]i and a slow, large membrane depolarization.
Figures
Similar articles
-
Carbachol-induced [Ca2+]i oscillations in single smooth muscle cells of guinea-pig ileum.J Physiol. 1996 Apr 15;492 ( Pt 2)(Pt 2):315-28. doi: 10.1113/jphysiol.1996.sp021311. J Physiol. 1996. PMID: 9019532 Free PMC article.
-
Modulation of carbachol-induced [Ca2+]i oscillations by Ca2+ influx in single intestinal smooth muscle cells.Br J Pharmacol. 1996 Sep;119(2):245-52. doi: 10.1111/j.1476-5381.1996.tb15978.x. Br J Pharmacol. 1996. PMID: 8886405 Free PMC article.
-
Role of Ca2+ mobilization in muscarinic receptor-mediated membrane depolarization in guinea pig ileal smooth muscle cells.Jpn J Pharmacol. 2000 Dec;84(4):431-7. doi: 10.1254/jjp.84.431. Jpn J Pharmacol. 2000. PMID: 11202616
-
Characterization of action potential-triggered [Ca2+]i transients in single smooth muscle cells of guinea-pig ileum.Br J Pharmacol. 1997 Oct;122(3):477-86. doi: 10.1038/sj.bjp.0701407. Br J Pharmacol. 1997. PMID: 9351504 Free PMC article.
-
Vasomotion: cellular background for the oscillator and for the synchronization of smooth muscle cells.Br J Pharmacol. 2005 Mar;144(5):605-16. doi: 10.1038/sj.bjp.0706084. Br J Pharmacol. 2005. PMID: 15678091 Free PMC article. Review.
Cited by
-
Possible role of transient receptor potential melastatin 4 channels in adrenergic contractions in mouse prostate smooth muscles.J Vet Med Sci. 2023 Jul 1;85(7):705-714. doi: 10.1292/jvms.23-0112. Epub 2023 May 23. J Vet Med Sci. 2023. PMID: 37225446 Free PMC article.
-
Deletion of TRPC4 and TRPC6 in mice impairs smooth muscle contraction and intestinal motility in vivo.Gastroenterology. 2009 Oct;137(4):1415-24. doi: 10.1053/j.gastro.2009.06.046. Epub 2009 Jun 21. Gastroenterology. 2009. PMID: 19549525 Free PMC article.
-
Localised calcium release events in cells from the muscle of guinea-pig gastric fundus.J Physiol. 2004 Feb 1;554(Pt 3):687-705. doi: 10.1113/jphysiol.2003.052571. Epub 2003 Nov 7. J Physiol. 2004. PMID: 14608011 Free PMC article.
-
Three distinct muscarinic signalling pathways for cationic channel activation in mouse gut smooth muscle cells.J Physiol. 2007 Jul 1;582(Pt 1):41-61. doi: 10.1113/jphysiol.2007.133165. Epub 2007 Apr 26. J Physiol. 2007. PMID: 17463038 Free PMC article.
-
Unraveling smooth muscle contraction: the TRP link.Gastroenterology. 2009 Oct;137(4):1211-4. doi: 10.1053/j.gastro.2009.08.025. Epub 2009 Aug 28. Gastroenterology. 2009. PMID: 19717126 Free PMC article. No abstract available.
References
-
- Bezprozvanny I, Watras J, Ehrlich BE. Bell-shaped calcium-response curves of Ins(1,4,5)P3- and calcium-gated channels from endoplasmic reticulum of cerebellum. Nature. 1991;351:751–754. - PubMed
-
- Bolton TB. Cholinergic mechanisms in smooth muscle. British Medical Bulletin. 1979a;35:275–283. - PubMed
-
- Bolton TB. Mechanisms of action of transmitters and other substances on smooth muscle. Physiological Reviews. 1979b;59:606–718. - PubMed
MeSH terms
Substances
LinkOut - more resources
Full Text Sources
Miscellaneous