. 1998 Aug 18;95(17):9903-8.
doi: 10.1073/pnas.95.17.9903.

The structural distribution of cooperative interactions in proteins: analysis of the native state ensemble

Affiliations

The structural distribution of cooperative interactions in proteins: analysis of the native state ensemble

V J Hilser et al. Proc Natl Acad Sci U S A. .

Abstract

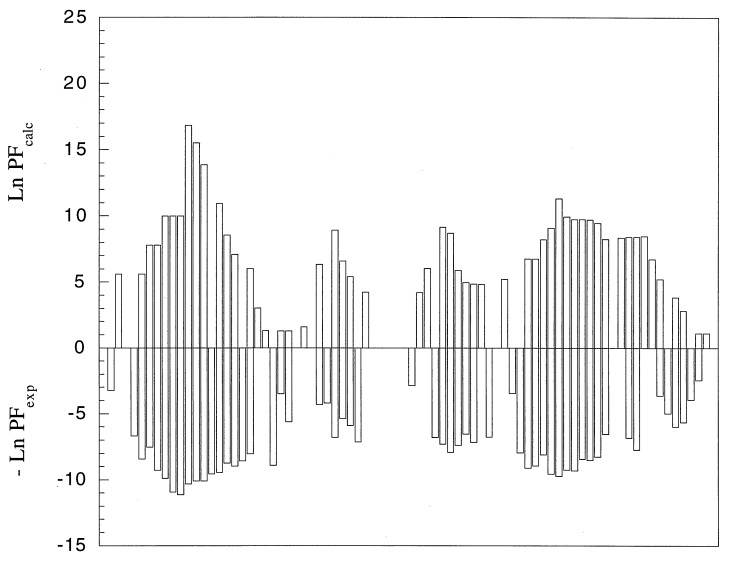
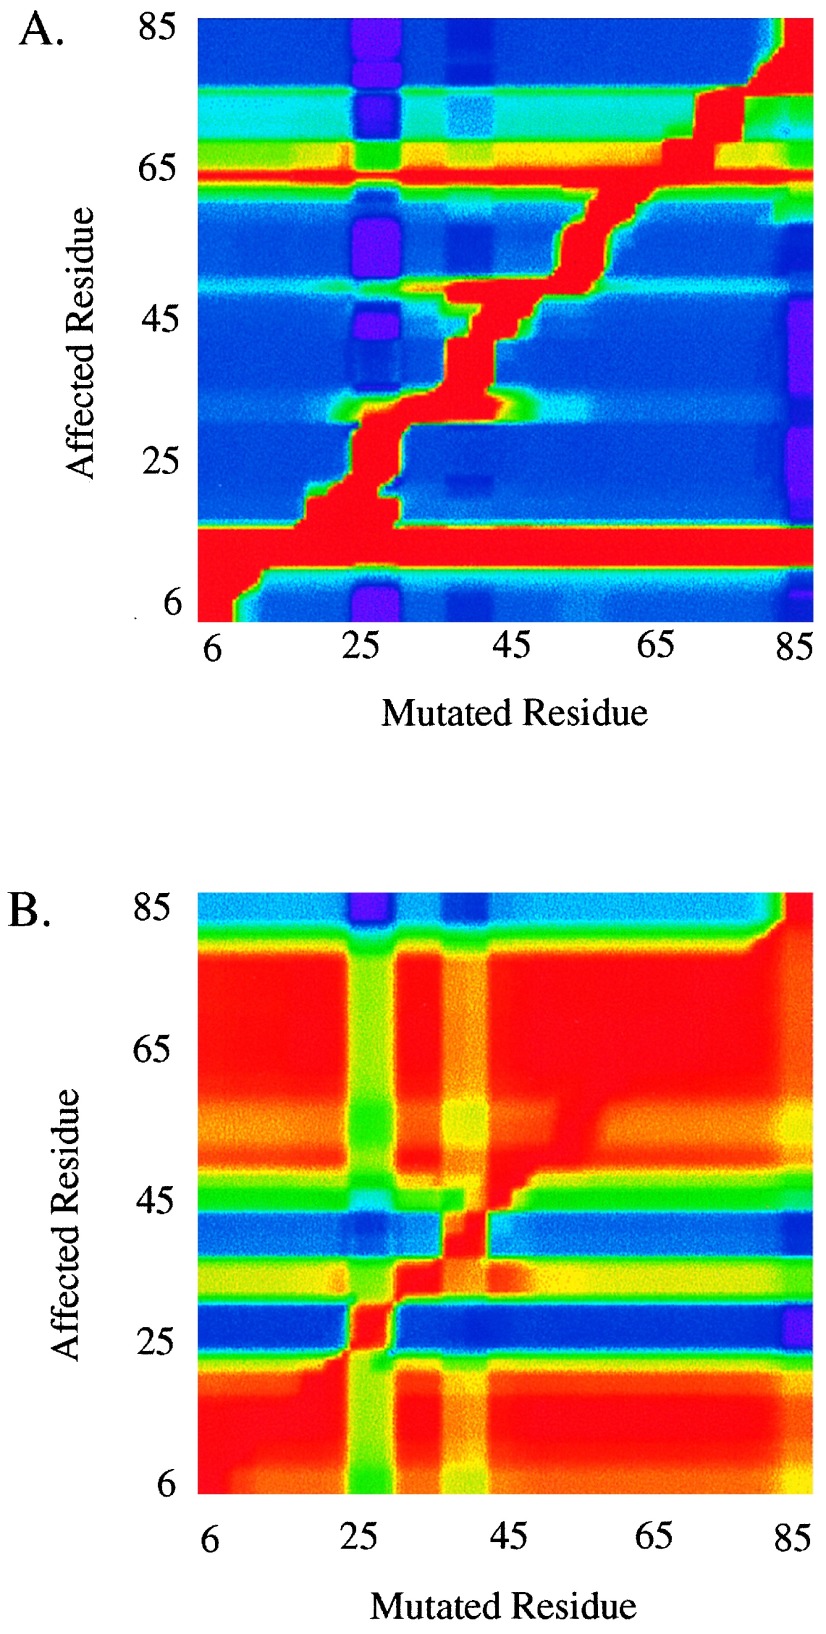
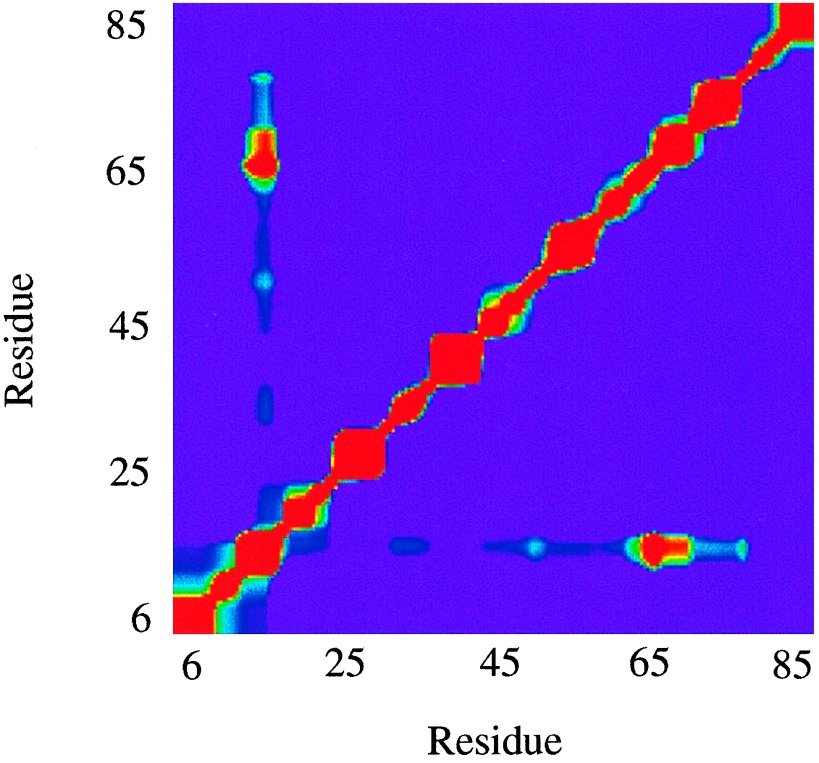
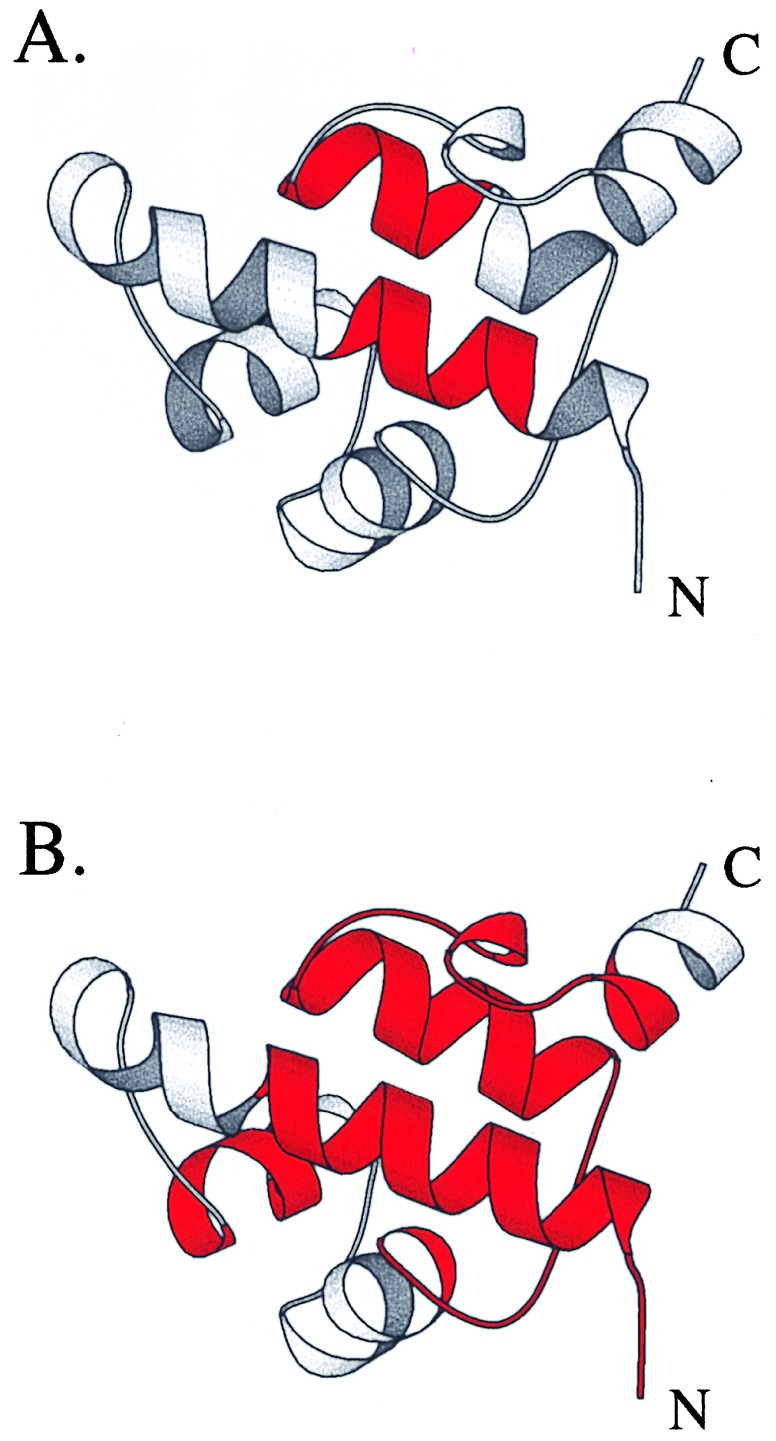
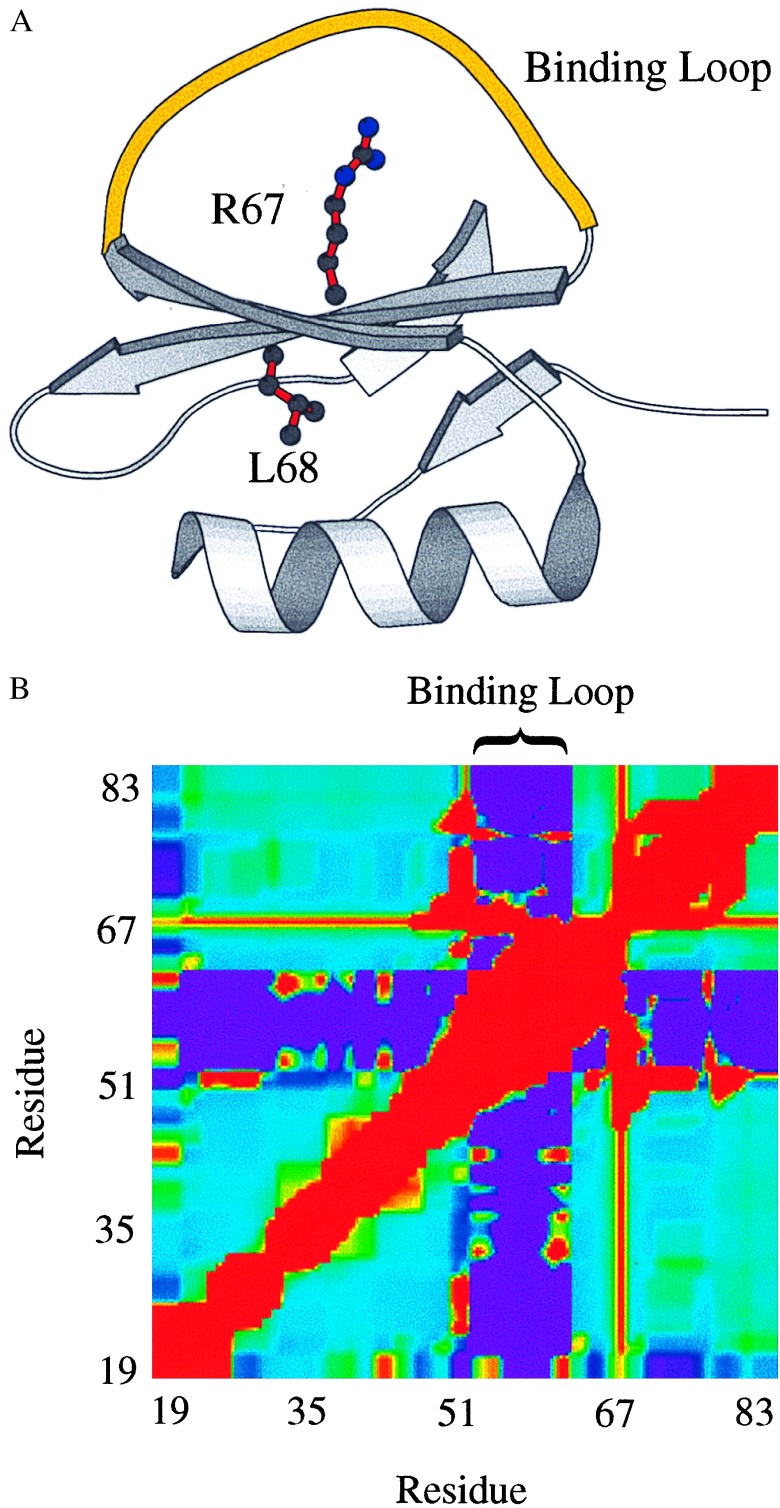
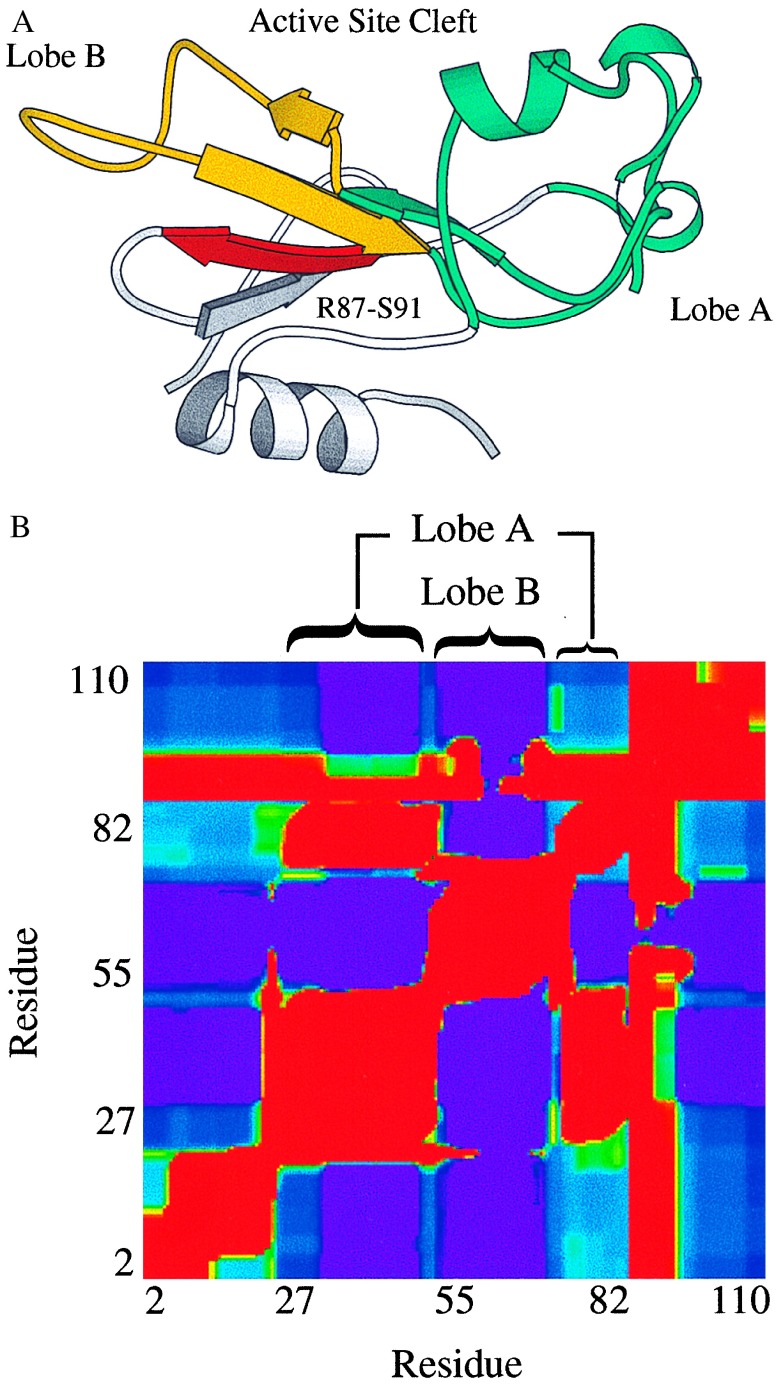
Cooperative interactions link the behavior of different amino acid residues within a protein molecule. As a result, the effects of chemical or physical perturbations to any given residue are propagated to other residues by an intricate network of interactions. Very often, amino acids "sense" the effects of perturbations occurring at very distant locations in the protein molecule. In these studies, we have investigated by computer simulation the structural distribution of those interactions. We show here that cooperative interactions are not intrinsically bi-directional and that different residues play different roles within the intricate network of interactions existing in a protein. The effect of a perturbation to residue j on residue k is not necessarily equal to the effect of the same perturbation to residue k on residue j. In this paper, we introduce a computer algorithm aimed at mapping the network of cooperative interactions within a protein. This algorithm exhaustively performs single site thermodynamic mutations to each residue in the protein and examines the effects of those mutations on the distribution of conformational states. The algorithm has been applied to three different proteins (lambda repressor fragment 6-85, chymotrypsin inhibitor 2, and barnase). This algorithm accounts well for the observed behavior of these proteins.


Figures

Figure 1
Figure 1
Natural logarithm (bars) of the calculated and experimental protection factors for λ6–85. The calculated values were determined as described by Hilser and Freire (12). The solid line above the calculated values represents the residue stability constant as defined from Eq. 1. This quantity is defined for all residues independently of whether they exhibit protection or not. Shown also in the figure are the corresponding elements of secondary structure. The good agreement between calculated and experimental values indicates that the calculated ensemble captures the general features of the actual ensemble and that the network of cooperative interactions in the protein are represented accurately in this model.
Figure 2
Figure 2
SSTM analysis of λ6–85 at (A) ΔGU = 8.5 kcal/mol and (B) ΔGU = 2.5 kcal/mol. Plotted is ΔΔGj,mutkGjmutk−ΔGjWT; where ΔGj = −RT ln κf,j), which represents the change in free energy at each residue j (ordinate) caused by a mutation at residue k (abscissa). For these calculations, the free energy of all states in which residue k is folded is stabilized by 1.0 kcal/mol. Red corresponds to a large effect (1.0 kcal/mol) whereas blue corresponds to a small effect (≈0.0 kcal/mol).
Figure 3
Figure 3
Mutual perturbation/response analysis of λ6–85 at conditions used to generate Fig. 2A (i.e., ΔGU = 8.5 kcal/mol). Plotted is ΔΔGMPR (Eq. 2) for each pair of residues. Red corresponds to a large effect (1.0 kcal/mol) whereas blue corresponds to a small effect (0.0 kcal/mol).
Figure 4
Figure 4
Ribbon diagrams of λ6–85 showing residues (colored red) that correspond to the cooperative core at (A) ΔGU = 8.5 kcal/mol and (B) ΔGU = 2.5 kcal/mol. Although distal in sequence, core residues represent a contiguous cluster in the three dimensional structure. This figure was generated by using the program molscript (32).
Figure 5
Figure 5
(A) Ribbon diagram of CI2 showing the binding loop (residues 53–62) highlighted in yellow. Side chains for the key linchpin residues R67 and L68 are shown. Both residues are part of the central β-strand; R67 projects into the binding loop, and L68 projects into the hydrophobic core formed by the β-sheet and the α-helix. This figure was generated by using molscript. (B) Mutual perturbation/response analysis of CI2 under native conditions. Plotted is ΔΔGMPR (Eq. 2) for each pair of residues, highlighting the difference between large (red), intermediate (blue), and small (purple) effects. Labeled are those residues belonging to the binding loop.
Figure 6
Figure 6
(A) Ribbon diagram of barnase showing the active site cleft. Shown in blue are residues comprising lobe A (residues 23–51 and 74–82). Shown in yellow are residues comprising lobe B (residues 50–73). The linchpin residues R87-S91 are part of one of the central β strands and are shown in red. This figure was generated by using molscript. (B)Mutual perturbation/response analysis of barnase under native conditions. Plotted is ΔΔGMPR (Eq. 2) for each pair of residues. Red corresponds to a large effect, purple corresponds to a small effect, and blue corresponds to an intermediate effect. Labeled are those residues belonging to lobe A (23–51 and 74–82) and lobe B (50–73).

Similar articles

Cited by

References

    1. Lumry R, Biltonen R, Brandts J F. Biopolymers. 1966;4:917–944. - PubMed
    1. Clarke J, Fersht A R. Fold Des. 1996;1:243–254. - PubMed
    1. Jeng M-F, Englander S W. J Mol Biol. 1991;221:1045–1061. - PubMed
    1. Radford S E, Buck M, Topping K D, Dobson C M, Evans P A. Proteins. 1992;14:237–248. - PubMed
    1. Loh S N, Prehoda K E, Wang J, Markley J L. Biochemistry. 1993;32:11022–11028. - PubMed

Publication types

MeSH terms