

Modulation of the chaperone heat shock cognate 70 by embryonic (pro)insulin correlates with prevention of apoptosis
- PMID: 9707581
- PMCID: PMC21442
- DOI: 10.1073/pnas.95.17.9950
Modulation of the chaperone heat shock cognate 70 by embryonic (pro)insulin correlates with prevention of apoptosis
Abstract
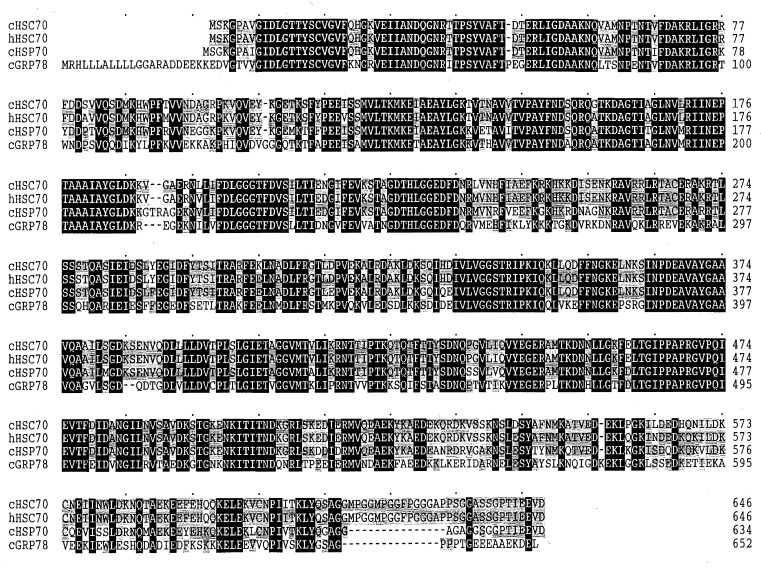
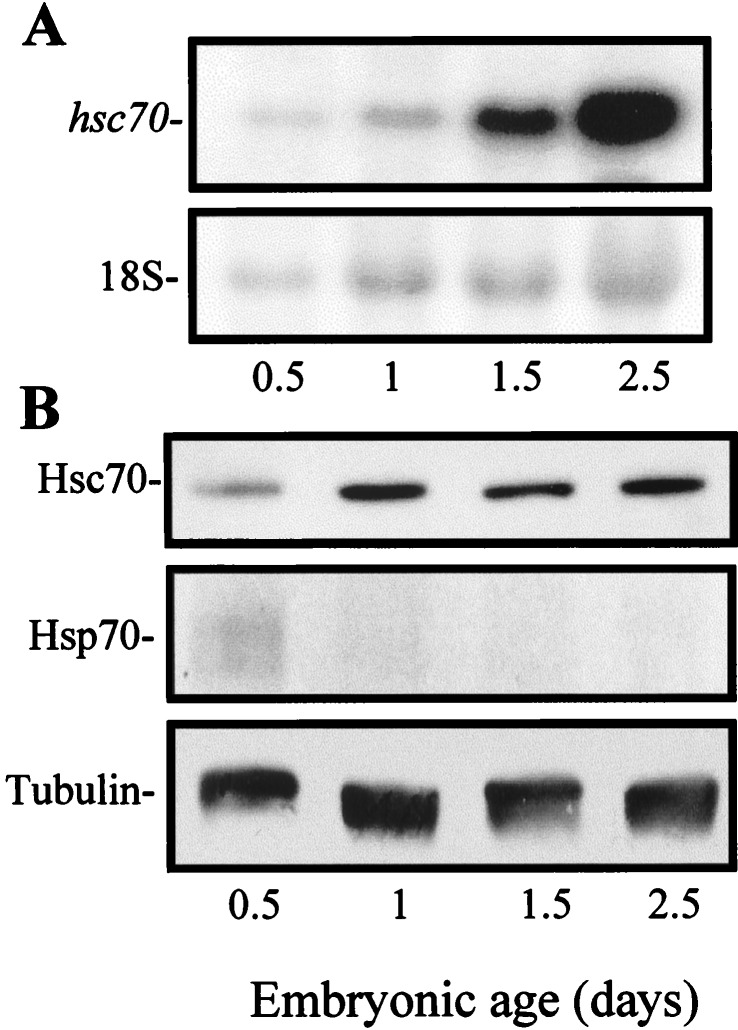
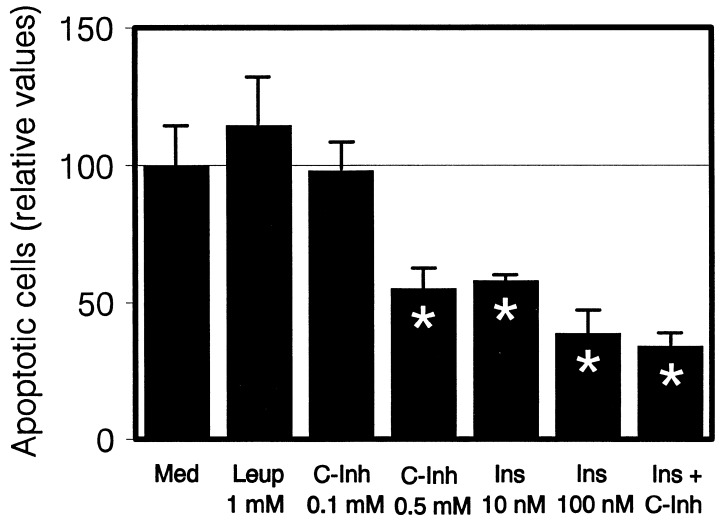
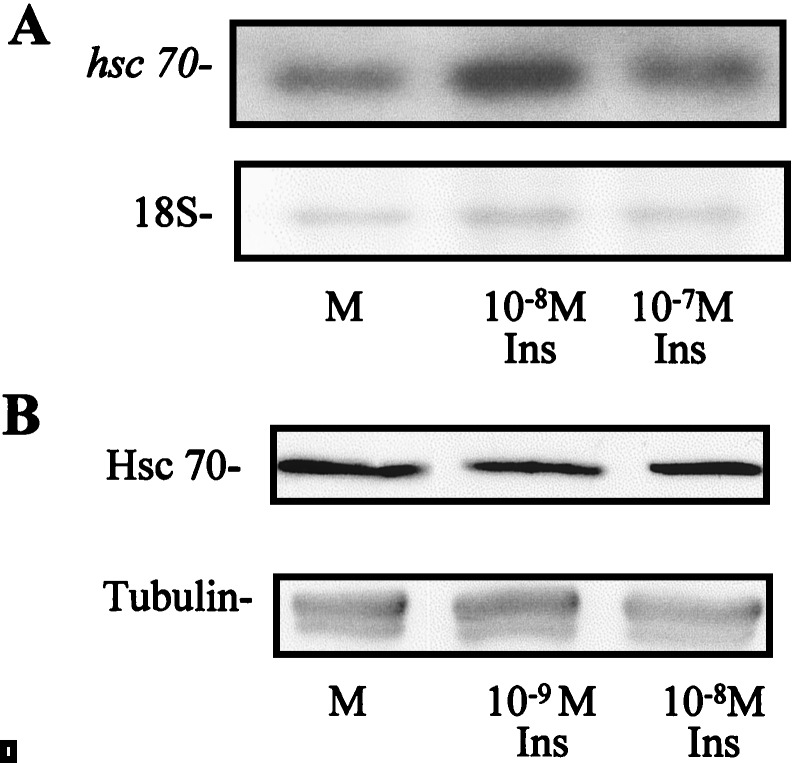
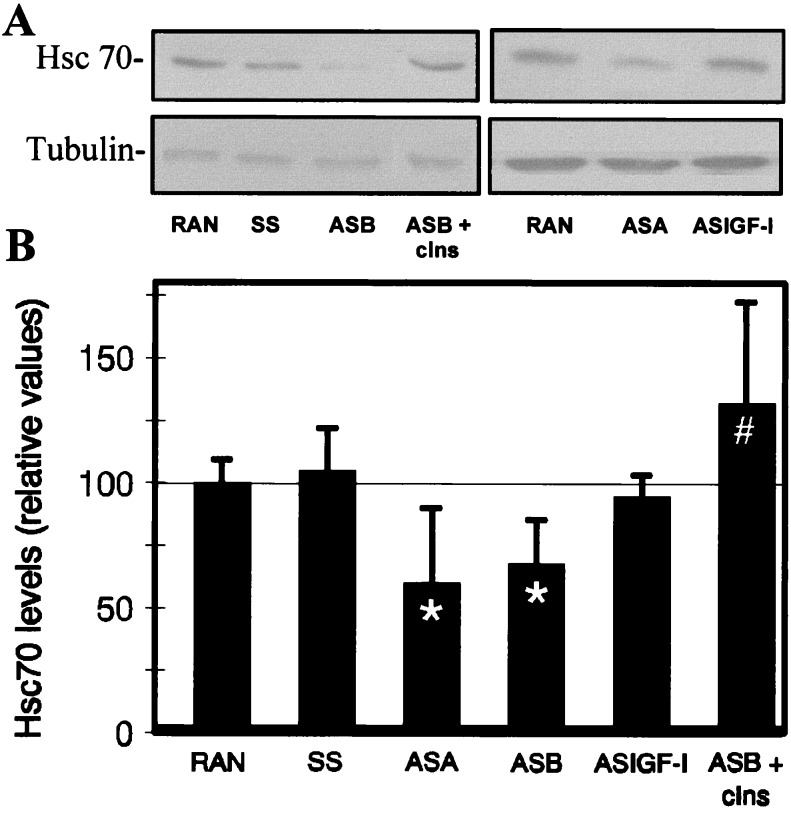
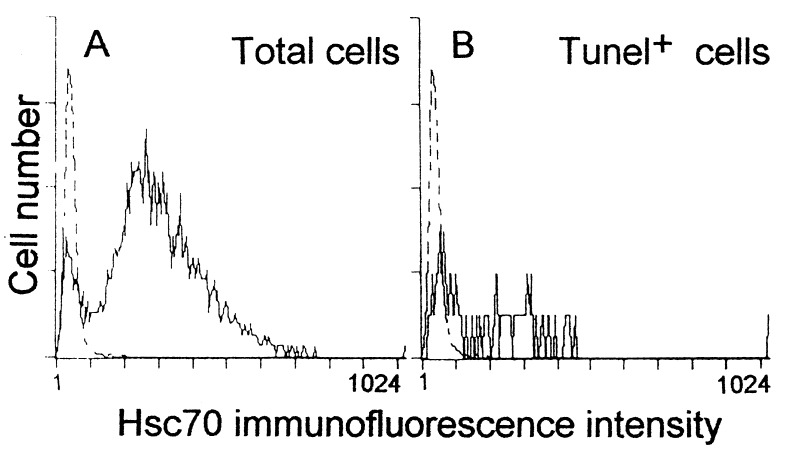
Insights have emerged concerning insulin function during development, from the finding that apoptosis during chicken embryo neurulation is prevented by prepancreatic (pro)insulin. While characterizing the molecules involved in this survival effect of insulin, we found insulin-dependent regulation of the molecular chaperone heat shock cognate 70 kDa (Hsc70), whose cloning in chicken is reported here. This chaperone, generally considered constitutively expressed, showed regulation of its mRNA and protein levels in unstressed embryos during early development. More important, Hsc70 levels were found to depend on endogenous (pro)insulin, as shown by using antisense oligodeoxynucleotides against (pro)insulin mRNA in cultured neurulating embryos. Further, in the cultured embryos, apoptosis affected mainly cells with the lowest level of Hsc70, as shown by simultaneous Hsc70 immunostaining and terminal deoxynucleotidyltransferase-mediated UTP nick end labeling. These results argue in favor of Hsc70 involvement, modulated by embryonic (pro)insulin, in the prevention of apoptosis during early development and suggest a role for a molecular chaperone in normal embryogenesis.
Figures
Similar articles
-
Identification of CHIP, a novel tetratricopeptide repeat-containing protein that interacts with heat shock proteins and negatively regulates chaperone functions.Mol Cell Biol. 1999 Jun;19(6):4535-45. doi: 10.1128/MCB.19.6.4535. Mol Cell Biol. 1999. PMID: 10330192 Free PMC article.
-
Heat shock proteins in retinal neurogenesis: identification of the PM1 antigen as the chick Hsc70 and its expression in comparison to that of other chaperones.Eur J Neurosci. 1998 Oct;10(10):3237-45. doi: 10.1046/j.1460-9568.1998.00332.x. Eur J Neurosci. 1998. PMID: 9786217
-
Programmed cell death in the neurulating embryo is prevented by the chaperone heat shock cognate 70.Eur J Neurosci. 2002 May;15(10):1646-54. doi: 10.1046/j.1460-9568.2002.01998.x. Eur J Neurosci. 2002. PMID: 12059972
-
Regulation of the heat shock conjugate Hsc70 in the mammalian cell: the characterization of the anti-apoptotic protein BAG-1 provides novel insights.Biol Chem. 1998 Mar;379(3):269-74. Biol Chem. 1998. PMID: 9563821 Review.
-
Heat shock protein 27: its potential role in vascular disease.Int J Exp Pathol. 2006 Aug;87(4):253-74. doi: 10.1111/j.1365-2613.2006.00484.x. Int J Exp Pathol. 2006. PMID: 16875491 Free PMC article. Review.
Cited by
-
Genetic variations in HSPA8 gene associated with coronary heart disease risk in a Chinese population.PLoS One. 2010 Mar 16;5(3):e9684. doi: 10.1371/journal.pone.0009684. PLoS One. 2010. PMID: 20300519 Free PMC article.
-
Proinsulin slows retinal degeneration and vision loss in the P23H rat model of retinitis pigmentosa.Hum Gene Ther. 2012 Dec;23(12):1290-300. doi: 10.1089/hum.2012.067. Epub 2012 Nov 5. Hum Gene Ther. 2012. PMID: 23017108 Free PMC article.
-
Mitochondrial DNA D-Loop Diversity of the Helmeted Guinea Fowls in Kenya and Its Implications on HSP70 Gene Functional Polymorphism.Biomed Res Int. 2018 Nov 13;2018:7314038. doi: 10.1155/2018/7314038. eCollection 2018. Biomed Res Int. 2018. PMID: 30539018 Free PMC article.
-
Anopheles gambiae heat shock protein cognate 70B impedes o'nyong-nyong virus replication.BMC Genomics. 2007 Jul 11;8:231. doi: 10.1186/1471-2164-8-231. BMC Genomics. 2007. PMID: 17625007 Free PMC article.
-
Cell death in the nervous system: lessons from insulin and insulin-like growth factors.Mol Neurobiol. 2003 Aug;28(1):23-50. doi: 10.1385/MN:28:1:23. Mol Neurobiol. 2003. PMID: 14514984 Review.
References
-
- Weil M, Jacobson M D, Raff M C. Curr Biol. 1997;7:281–284. - PubMed
-
- Heath J K, Valancius-Mangel V. Curr Opin Cell Biol. 1991;3:935–938. - PubMed
-
- Harris W A. Curr Opin Genet Dev. 1997;7:651–658. - PubMed
-
- Pérez-Villamil B, de la Rosa E J, Morales A V, de Pablo F. Endocrinology. 1994;135:2342–2350. - PubMed
-
- Morales A V, Serna J, Alarcón C, de la Rosa E J, de Pablo F. Endocrinology. 1997;138:3967–3975. - PubMed
Publication types
MeSH terms
Substances
Associated data
- Actions
LinkOut - more resources
Full Text Sources
Molecular Biology Databases
Miscellaneous
