. 1998 Aug 18;95(17):10100-5.
doi: 10.1073/pnas.95.17.10100.

The neuregulin, glial growth factor 2, diminishes autoimmune demyelination and enhances remyelination in a chronic relapsing model for multiple sclerosis

Affiliations

The neuregulin, glial growth factor 2, diminishes autoimmune demyelination and enhances remyelination in a chronic relapsing model for multiple sclerosis

B Cannella et al. Proc Natl Acad Sci U S A. .

Abstract

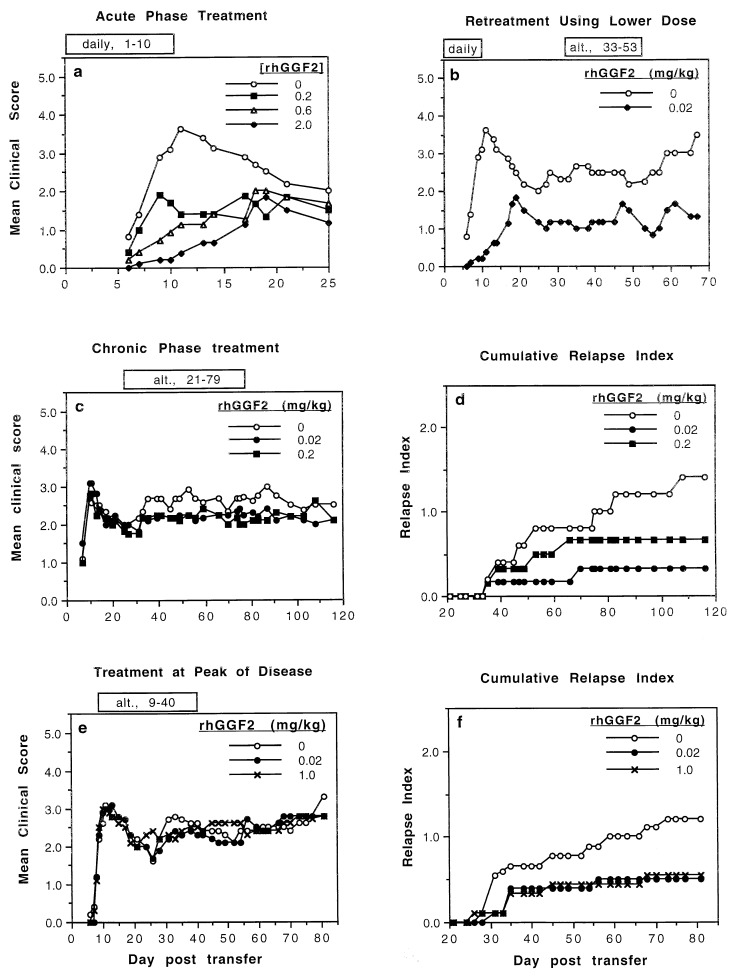
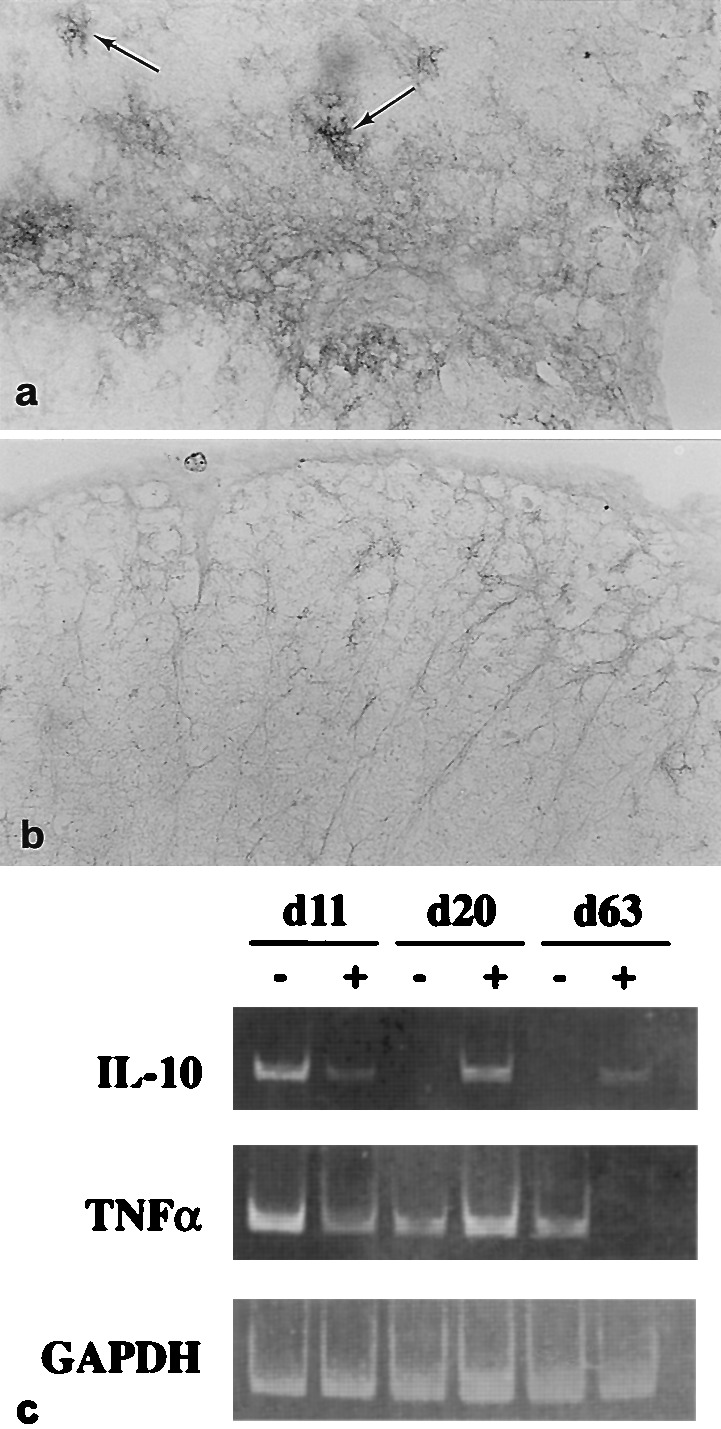
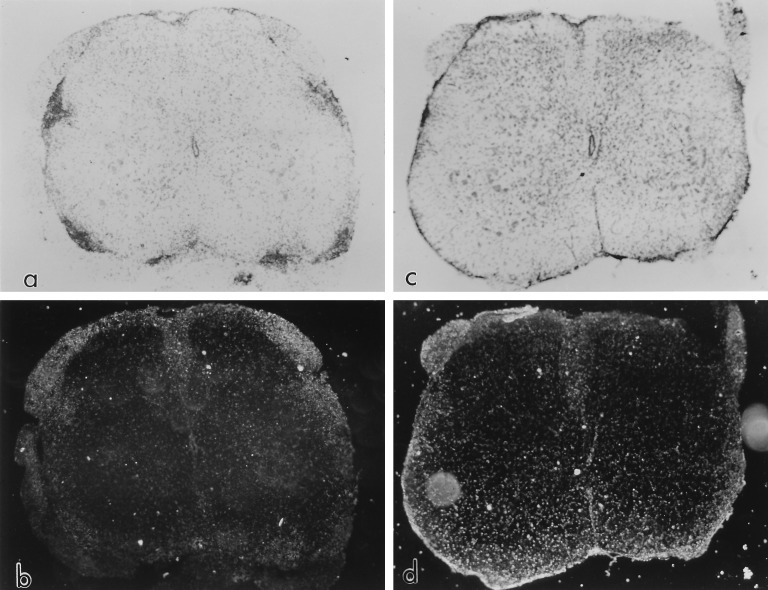
Glial growth factor 2 (GGF2) is a neuronal signal that promotes the proliferation and survival of the oligodendrocyte, the myelinating cell of the central nervous system (CNS). The present study examined whether recombinant human GGF2 (rhGGF2) could effect clinical recovery and repair to damaged myelin in chronic relapsing experimental autoimmune encephalomyelitis (EAE) in the mouse, a major animal model for the human demyelinating disease, multiple sclerosis. Mice with EAE were treated with rhGGF2 during both the acute and relapsing phases. Clinically, GGF2 treatment delayed signs, decreased severity, and resulted in statistically significant reductions in relapse rate. rhGGF2-treated groups displayed CNS lesions with more remyelination than in controls. This correlated with increased mRNA expression of myelin basic protein exon 2, a marker for remyelination, and with an increase in the CNS of the regulatory cytokine, interleukin 10, at both the RNA and protein levels. Thus, a beneficial effect of a neurotrophic growth factor has been demonstrated on the clinical, pathologic, and molecular manifestations of autoimmune demyelination, an effect that was associated with increased expression of a T helper 2 cytokine. rhGGF2 treatment may represent a novel approach to the treatment of multiple sclerosis.


Figures

Figure 1
Figure 1
Effect of treatment on clinical course of EAE in SJL/J mice. (a) Mice treated daily by s.c. injections days 1–10 posttransfer (dpt) with vehicle and 0.2, 0.6, or 2.0 mg/kg rhGGF2. Mean clinical score plotted for each group (n = 6). Differences between 2.0 mg/kg rhGGF2 and vehicle groups significant (P < 0.001). (b) Same animals as in a retreated on alternate days in the chronic phase of EAE from 33–53 dpt as follows: vehicle group retreated with vehicle; 2.0 mg/kg rhGGF2 group, with 0.02 mg/kg rhGGF2. Mean clinical score observed for each group (n = 3) until 67 dpt. Differences significant (P < 0.001). (c) Animals (n = 6) treated on alternate days from 21 to 79 dpt, using vehicle, 0.02 or 0.2 mg/kg. Observations conducted until 116 dpt. Mean clinical score plotted for each group (n = 6). (d) The cumulative relapse index of animals shown (c) that displayed a relapsing and remitting pattern of disease (n = 5, vehicle; n = 6, 0.02 mg/kg; and n = 6, 0.2 mg/kg). The cumulative relapse index for each group after 116 dpt was 1.40 (vehicle), 0.33 (0.02 mg/kg) and 0.66 (0.2 mg/kg). The reduction in relapse rate for each rhGGF2-treated compared with vehicle-treated group (100%) was 76% (0.02 mg/kg) and 53% (0.2 mg/kg). (P < 0.05, Mann–Whitney U test). (e) Treatment from 9 dpt, the peak of acute clinical signs, until 40 dpt on alternate days using vehicle, 0.02 or 1.0 mg/kg rhGGF2. Mean clinical score plotted for each group (n = 13 at 0 dpt) until end of observation period (n = 6, at day 66, and n = 4, at day 81). (f) Relapse index tabulated for animals in (e) that displayed a relapsing and remitting pattern (n = 10) observed from 21- 81 dpt. The cumulative relapse index for each group of relapsing-remitting animals at 81 dpt was 1.1 (vehicle), 0.50 (0.02 mg/kg) and 0.55 (1.0 mg/kg). The reduction in relapse rate for each rhGGF2 compared with vehicle-treated group (100%) was 58% (0.02 mg/kg) and 54% (1.0 mg/kg). Difference in cumulative relapse index between vehicle and each rhGGF2 treatment group significant (P < 0.05, Mann–Whitney U test).
Figure 2
Figure 2
Histopathology of spinal cord vehicle- and rhGGF2-treated mice; 1 μm epoxy sections; toluidine blue stain. (Bar = 10 μm.) (a) Acute EAE. Experiment 3: Vehicle treatment 1–10 dpt; sampled 11 dpt; clinical grade 4. An area of subpial spinal cord displays extensive inflammation. Note the many myelin-laden macrophages and scattered demyelinated axons (arrows). (×875.) (b) Acute EAE. Matching level of spinal cord to a, treated with rhGGF2 (2 mg/kg) 1–10 dpt; sampled 11 dpt; clinical grade 0.5. A matching area of spinal cord displays no lesion activity. Oligodendrocytes difficult to discern. (×875.) (c) Chronic relapsing EAE. Experiment 4: Vehicle 31–55 dpt; sampled 60 dpt; clinical grade 3. A chronic gliotic lesion contains macrophages and displays many demyelinated axons (arrows). Oligodendrocytes difficult to discern. (×875.) (d) Chronic EAE. rhGGF2 (2.0 mg/kg) 31–55 dpt; sampled 60 dpt; clinical grade 3.5; spinal cord. Despite the comparable clinical grade of this matching animal to that shown in (c), note the large amount of CNS remyelination (large arrows). Some demyelinated axons (small arrows) lie toward the subpial surface. Numerous oligodendrocytes (∗) identified by their rounded nuclei and clumped heterochromatin, can be seen. (×875.) (e) Chronic relapsing EAE. Experiment 7: Vehicle 21–79 dpt; sampled day 81; clinical grade 3. A subpial lesion from the L7 spinal cord level displays intense fibrous astrogliosis, fibrotic blood vessels, and numerous demyelinated axons (arrows), but no obvious oligodendrocytes. (×875.) (f) Chronic relapsing EAE. rhGGF2 (0.2 mg/kg and 0.02 mg/kg) days 21–79; sampled day 81; clinical grade 2. Matching animal to e, same level of spinal cord. Note the more compact, less gliotic parenchyma and presence of remyelinated CNS fibers (arrows). A few oligodendrocytes (∗) are present. (×875.)
Figure 3
Figure 3
Ultrastructure of CNS of vehicle- and rhGGF2- treated mice. (Bar = 1 μm.) (a) L7 spinal cord, vehicle, 31–55 dpt; sampled 60 dpt; clinical grade 3, same animal as Fig. 2c. Note extensive fibrous astrogliosis, Wallerian degeneration, myelin debris, and nerve fiber loss. Meningeal surface (m) above. (×6,650.) (b) Matching level of spinal cord to a, rhGGF2 (2.0 mg/kg) 31–55 dpt; sampled 60 dpt; clinical grade 3.5, same animal as Fig. 2d. Thinly remyelinated CNS fibers surround an oligodendrocyte. (×6,650.)
Figure 4
Figure 4
Th2-type cytokine expression and GGF2-treatment. (a) Lumbar spinal cord; rhGGF2-mouse (1.0 mg/kg; 9–40 dpt), sampled 42 dpt shows high level immunoreactivity for IL-10 on perivascular and parenchymal astrocytes (arrows) bordering a penetrating blood vessel. (×250.) (b) A comparable area of lumbar spinal cord from a control mouse at 42 dpt displays low level reactivity for IL-10. (×250.) (c) reverse transcription–PCR analysis of CNS tissue. Representative mice (n = 6) from acute (11 dpt), remission (20 dpt) and chronic (63 dpt) phases of EAE, from vehicle (−) and rhGGF2-treated (+) groups for analysis of cytokine gene expression. At 11 and 20 dpt, the rhGGF2-treated animals were from the 2.0 mg/kg group, whereas at 63 dpt, animals from the 0.8 mg/kg group were selected. RNA from spinal cord was analyzed by reverse transcription–PCR using specific primers for IL-10, TNFα, or glyceraldehyde-3-phosphate dehydrogenase. DNA amplification products analyzed by gel electrophoresis were 455 bp, 354 bp, and 356 bp, respectively. Note increased levels of IL-10 RNA in rhGGF2-treated animals at days 20 and 63 dpt, and the marked decrease of TNFα at 63 dpt in the same group.
Figure 5
Figure 5
In situ hybridization for MBP exon 2 message.(a) Bright field microscopy shows punctate lesion activity in a vehicle-treated mouse sensitized for EAE. Vehicle; 1–40 dpt; sampled 64 dpt; clinical grade 2.5. No counterstain. (×20.) (b) Same section as in a, in situ hybridization, developed for anti-sense MBP exon 2 message. Background levels of MBP exon 2 mRNA seen throughout the spinal cord with some elevation over dorsal roots (above). (×20.) (c) Matching animal to a treated with rhGGF2 (0.8 mg/kg) 0–40 dpt; sampled 64 dpt; clinical grade 3.5. No obvious lesions apparent other than some inflammation over the spinal cord. No counterstain (×20.) (d) Same section as in c, in situ hybridization, developed for MBP exon 2 message. Note enhanced signal for MBP exon 2 over anterior and lateral columns, probably indicative of diffuse CNS remyelination. Some elevation of signal occurs over the dorsal roots and meninges. (×20.)

References

    1. Goodkin D E. In: Multiple Sclerosis Clinical and Pathogenetic Basis. Raine C S, McFarland H F, Tourtellotte W W, editors. London: Chapman & Hall; 1997. pp. 307–324.
    1. Brosnan C F, Racke M K, Selmaj K. In: Multiple Sclerosis Clinical and Pathogenetic Basis. Raine C S, McFarland H F, Tourtellotte W W, editors. London: Chapman & Hall; 1997. pp. 325–340.
    1. Raine C S. In: Multiple Sclerosis Clinical and Pathogenetic Basis. Raine C S, McFarland H F, Tourtellotte W W, editors. London: Chapman & Hall; 1997. pp. 243–286.
    1. Prineas J W, McDonald W I. In: Greenfield’s Neuropathology. Graham D I, Lantos P L, editors. Oxford: Oxford Univ. Press; 1997. pp. 813–896.
    1. Mokhtarian F, McFarlin D E, Raine C S. Nature (London) 1984;309:356–358. - PubMed

Publication types

MeSH terms