

Brain-derived neurotrophic factor modulates hippocampal synaptic transmission by increasing N-methyl-D-aspartic acid receptor activity
- PMID: 9707630
- PMCID: PMC21491
- DOI: 10.1073/pnas.95.17.10235
Brain-derived neurotrophic factor modulates hippocampal synaptic transmission by increasing N-methyl-D-aspartic acid receptor activity
Abstract
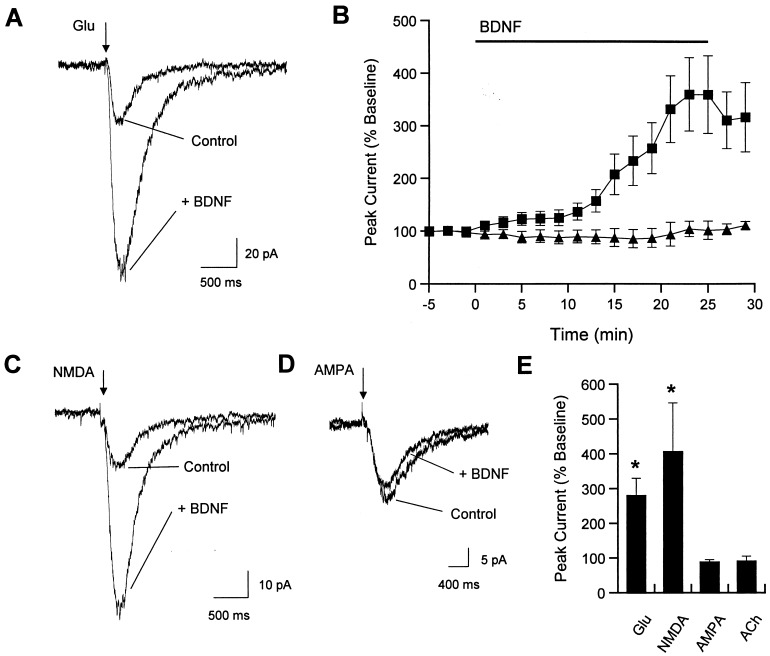
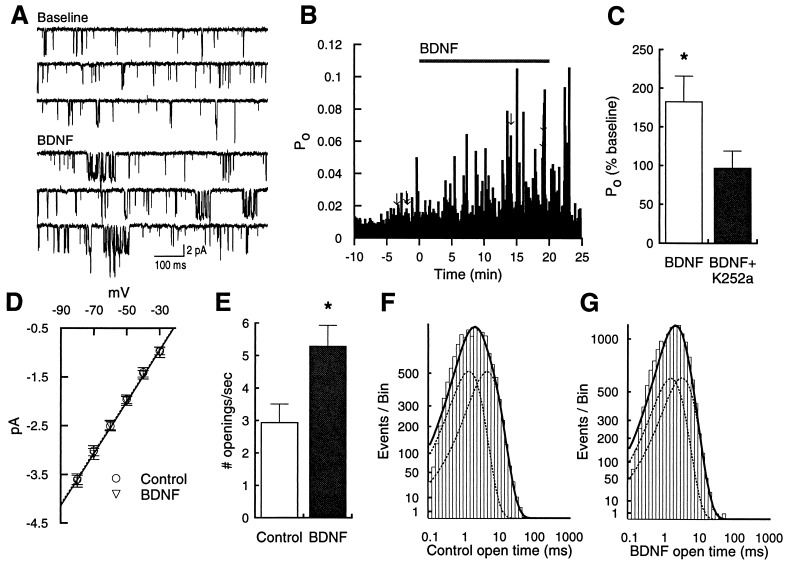
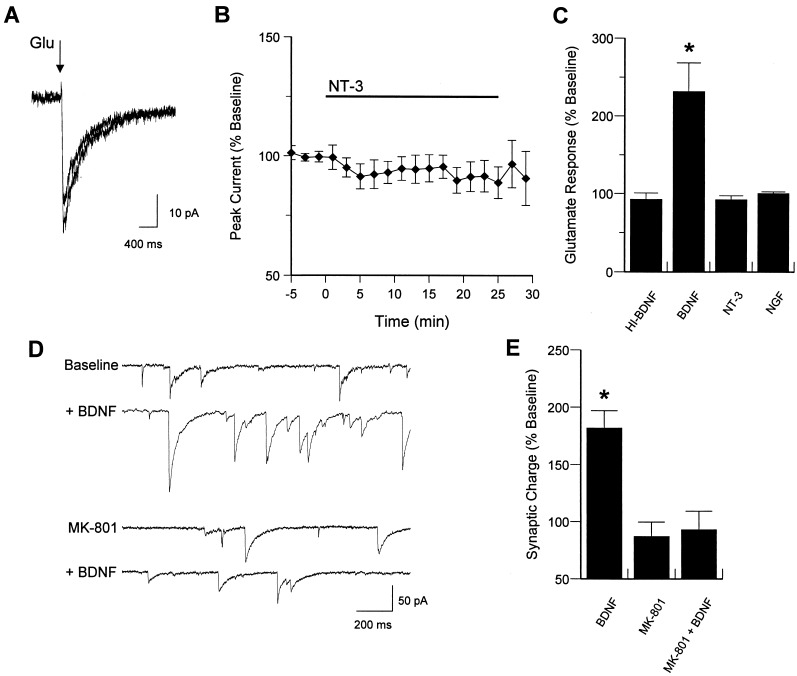
Neurotrophins (NTs) have recently been found to regulate synaptic transmission in the hippocampus. Whole-cell and single-channel recordings from cultured hippocampal neurons revealed a mechanism responsible for enhanced synaptic strength. Specifically, brain-derived neurotrophic factor augmented glutamate-evoked, but not acetylcholine-evoked, currents 3-fold and increased N-methyl-D-aspartic acid (NMDA) receptor open probability. Activation of trkB NT receptors was critical, as glutamate currents were not affected by nerve growth factor or NT-3, and increased open probability was prevented by the tyrosine kinase inhibitor K-252a. In addition, the NMDA receptor antagonist MK-801 blocked brain-derived neurotrophic factor enhancement of synaptic transmission, further suggesting that NTs modulate synaptic efficacy via changes in NMDA receptor function.
Figures
Similar articles
-
Neurotrophin modulation of NMDA receptors in cultured murine and isolated rat neurons.J Neurophysiol. 1997 Nov;78(5):2363-71. doi: 10.1152/jn.1997.78.5.2363. J Neurophysiol. 1997. PMID: 9356388
-
The excitoprotective effect of N-methyl-D-aspartate receptors is mediated by a brain-derived neurotrophic factor autocrine loop in cultured hippocampal neurons.J Neurochem. 2005 Aug;94(3):713-22. doi: 10.1111/j.1471-4159.2005.03200.x. Epub 2005 Jul 5. J Neurochem. 2005. PMID: 16000165
-
Modulation of unitary glutamatergic synapses by neurotrophin-4/5 or brain-derived neurotrophic factor in hippocampal microcultures: presynaptic enhancement depends on pre-established paired-pulse facilitation.Neuroscience. 1998 Sep;86(2):399-413. doi: 10.1016/s0306-4522(98)00035-9. Neuroscience. 1998. PMID: 9881855
-
Modulation of hippocampal synaptic transmission and plasticity by neurotrophins.Prog Brain Res. 2000;128:231-41. doi: 10.1016/S0079-6123(00)28020-5. Prog Brain Res. 2000. PMID: 11105682 Review. No abstract available.
-
Cerebral protection by adenosine.Acta Neurochir Suppl (Wien). 1993;57:80-8. doi: 10.1007/978-3-7091-9266-5_12. Acta Neurochir Suppl (Wien). 1993. PMID: 8380674 Review.
Cited by
-
Postsynaptic TrkB-mediated signaling modulates excitatory and inhibitory neurotransmitter receptor clustering at hippocampal synapses.J Neurosci. 2004 Mar 10;24(10):2380-93. doi: 10.1523/JNEUROSCI.4112-03.2004. J Neurosci. 2004. PMID: 15014113 Free PMC article.
-
Brain-derived neurotrophic factor triggers transcription-dependent, late phase long-term potentiation in vivo.J Neurosci. 2002 Sep 1;22(17):7453-61. doi: 10.1523/JNEUROSCI.22-17-07453.2002. J Neurosci. 2002. PMID: 12196567 Free PMC article.
-
Cultured rat hippocampal neural progenitors generate spontaneously active neural networks.Proc Natl Acad Sci U S A. 2002 Feb 5;99(3):1621-6. doi: 10.1073/pnas.022646599. Epub 2002 Jan 29. Proc Natl Acad Sci U S A. 2002. PMID: 11818538 Free PMC article.
-
Linking Migraine to Gut Dysbiosis and Chronic Non-Communicable Diseases.Nutrients. 2023 Oct 11;15(20):4327. doi: 10.3390/nu15204327. Nutrients. 2023. PMID: 37892403 Free PMC article. Review.
-
Emergence of brain-derived neurotrophic factor-induced postsynaptic potentiation of NMDA currents during the postnatal maturation of the Kolliker-Fuse nucleus of rat.J Physiol. 2008 May 1;586(9):2331-43. doi: 10.1113/jphysiol.2007.148916. Epub 2008 Mar 13. J Physiol. 2008. PMID: 18339694 Free PMC article.
References
Publication types
MeSH terms
Substances
Grants and funding
LinkOut - more resources
Full Text Sources
Research Materials
