. 1998 Sep 1;18(17):6977-89.
doi: 10.1523/JNEUROSCI.18-17-06977.1998.

The striatal neurotensin receptor modulates striatal and pallidal glutamate and GABA release: functional evidence for a pallidal glutamate-GABA interaction via the pallidal-subthalamic nucleus loop

Affiliations

The striatal neurotensin receptor modulates striatal and pallidal glutamate and GABA release: functional evidence for a pallidal glutamate-GABA interaction via the pallidal-subthalamic nucleus loop

L Ferraro et al. J Neurosci. .

Abstract

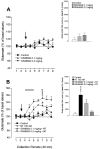
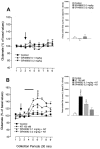
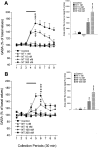
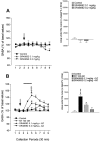
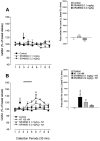
In the present study, we used dual-probe microdialysis to investigate the effects of intrastriatal perfusion with neurotensin (NT) on striatal and pallidal glutamate and GABA release. The role of the pallidal GABAA receptor in the intrastriatal NT-induced increase in pallidal glutamate release was also investigated. Intrastriatal NT (100 and 300 nM) increased striatal glutamate and GABA (100 nM, 155 +/- 9 and 141 +/- 6%, respectively; 300 nM, 179 +/- 8 and 166 +/- 11%, respectively) release, as well as pallidal glutamate and GABA (100 nM, 144 +/- 8 and 130 +/- 5%; 300 nM, 169 +/- 9 and 157 +/- 8%, respectively) release. These effects were dose-dependently antagonized by the NT receptor antagonist 2-[(1-(7-chloro-4-quinolinyl)-5-(2, 6-dimethoxy-phenyl)pyrazol-3-yl)carboxylamino]tricyclo)3.3.1 .1.3. 7)-decan-2-carboxylic acid (SR48692). Intrasubthalamic injection of the GABAA receptor antagonist (-)-bicuculline (10 pmol/100 nl, 30 sec) rapidly increased pallidal glutamate release, whereas the intrastriatal NT-induced increase in pallidal glutamate release was counteracted by intrapallidal perfusion with (-)-bicuculline, suggesting that an increase in striopallidal GABA-mediated inhibition of the GABAergic pallidal-subthalamic pathway results in an increased glutamatergic drive in the subthalamic-pallidal pathway. These results demonstrate a tonic pallidal GABA-mediated inhibition of excitatory subthalamic-pallidal neurons and strengthen the evidence for a functional role of NT in the regulation of glutamate and GABA transmission in the basal ganglia. The ability of intrastriatal SR48692 to counteract the NT-induced increase in both striatal and pallidal glutamate and GABA release suggests that blockade of the striatal NT receptor may represent a possible new therapeutic strategy in the treatment of those hypokinetic disorders implicated in disorders of the indirect pathway mediating motor inhibition.


Figures
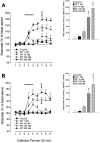
Fig. 1.
Fig. 1.
Effects of intrastriatal perfusion with NT on striatal (A) and pallidal (B) glutamate release in the awake rat.Solid bars indicate the period of perfusion with the peptide (60 min). The results are expressed as percentage of the mean of the three basal values before treatment. For absolute glutamate basal levels, see Results. Each point represents the mean ± SEM of five to seven animals. Control rats were perfused with normal Ringer’s perfusion medium throughout the experiment. The histograms of the areas under the curves, calculated as percentage of changes in basal value over time (Δ basal percentage × time) by using the trapezoidal rule, are shown on the right. **p < 0.01 significantly different from control; °p < 0.05 significantly different from 100 nm NT according to one-way ANOVA, followed by the Newman–Keuls test for multiple comparisons.
Fig. 2.
Fig. 2.
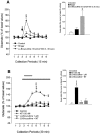
Effects of intraperitoneal injection of the NT receptor antagonist SR48692 on basal (A) and NT-induced (100 nm) (B) glutamate release from the striatum of the awake rat. Arrowsindicate the injection of SR48692, whereas the solid barin B indicates the period of perfusion with the peptide (60 min). The results are expressed as percentage of the mean of the three basal values before treatment. Each point represents the mean ± SEM of five or six animals. The histograms of the areas under the curves, calculated as percentage of changes in basal value over time (Δ basal percentage × time) by using the trapezoidal rule, are shown on the right. *p < 0.05, **p < 0.01 significantly different from control; °p < 0.05, °°p< 0.01 significantly different from 0.1 mg/kg SR48692 plus NT according to one-way ANOVA, followed by the Newman–Keuls test for multiple comparisons.
Fig. 3.
Fig. 3.
Effects of intraperitoneal injection of the NT receptor antagonist SR48692 on basal (A) and NT-induced (100 nm) (B) glutamate release from the GP of the awake rat. Arrows indicate the injection of SR48692. NT was perfused into the striatum for 60 min (solid bar). The results are expressed as percentage of the mean of the three basal values before treatment. Each point represents the mean ± SEM of five or six animals. The histograms of the areas under the curves, calculated as percentage of changes in basal value over time (Δ basal percentage × time) by using the trapezoidal rule, are shown on the right. **p < 0.01 significantly different from control; °p < 0.05, °°p < 0.01 significantly different from 0.1 mg/kg SR48692 plus NT according to one-way ANOVA, followed by the Newman–Keuls test for multiple comparisons.
Fig. 4.
Fig. 4.
Effects of intrastriatal perfusion with the NT receptor antagonist SR48692 on NT-induced (100 nm) glutamate release from the GP of the awake rat. NT was perfused into the striatum for 60 min (solid bar), whereas SR48692 was added to the striatal perfusion medium 20 min before the peptide and maintained until the end of the experiment (open bar). The results are expressed as percentage of the mean of the three basal values before treatment. Each point represents the mean ± SEM of five or six animals. The histograms of the areas under the curves, calculated as percentage of changes in basal value over time (Δ basal percentage × time) by using the trapezoidal rule, are shown on the right. **p < 0.01 significantly different from control; °°p < 0.01 significantly different from 100 nm SR48692 plus NT according to one-way ANOVA, followed by the Newman–Keuls test for multiple comparisons.
Fig. 5.
Fig. 5.
Effects of intrastriatal perfusion with NT on striatal (A) and pallidal (B) GABA release in the awake rat. Solid bars indicate the period of perfusion with the peptide (60 min). The results are expressed as percentage of the mean of the three basal values before treatment. For absolute GABA basal levels, see Results. Each point represents the mean ± SEM of five to seven animals. Control rats were perfused with normal Ringer’s perfusion medium throughout the experiment. The histograms of the areas under the curves, calculated as percentage of changes in basal value over time (Δ basal percentage × time) by using the trapezoidal rule, are shown on the right. **p < 0.01 significantly different from control; °p < 0.05, °°p < 0.01 significantly different from 100 nm NT according to one-way ANOVA, followed by the Newman–Keuls test for multiple comparisons.
Fig. 6.
Fig. 6.
Effects of intraperitoneal injection of the NT receptor antagonist SR48692 on basal (A) and NT-induced (100 nm) (B) GABA release from the striatum of the awake rat. Arrows indicate the injection of SR48692, whereas the solid bar indicates the period of perfusion with the peptide (60 min). The results are expressed as percentage of the mean of the three basal values before treatment. Each point represents the mean ± SEM of five or six animals. The histograms of the areas under the curves, calculated as percentage of changes in basal value over time (Δ basal percentage × time) by using the trapezoidal rule, are shown on the right. *p < 0.05, **p < 0.01 significantly different from control; °°p < 0.01 significantly different from 0.1 mg/kg SR48692 plus NT according to one-way ANOVA, followed by the Newman–Keuls test for multiple comparisons.
Fig. 7.
Fig. 7.
Effects of intraperitoneal injection of the NT receptor antagonist SR48692 on basal (A) and NT-induced (100 nm) (B) GABA release from the GP of the awake rat. Arrows indicate the injection of SR48692. NT was perfused into the striatum for 60 min (solid bar). The results are expressed as percentage of the mean of the three basal values before treatment. Each point represents the mean ± SEM of five or six animals. The histograms of the areas under the curves, calculated as percentage of changes in basal value over time (Δ basal percentage × time) by using the trapezoidal rule, are shown on the right. *p < 0.05, **p < 0.01 significantly different from control; °p < 0.05, °°p < 0.01 significantly different from 0.1 mg/kg SR48692 plus NT according to one-way ANOVA, followed by the Newman–Keuls test for multiple comparisons.
Fig. 8.
Fig. 8.
A, Effects of intrasubthalamic injection of the GABAA receptor antagonist (−)-bicuculline on basal glutamate release from the GP of the awake rat. (−)-Bicuculline (10 pmol/100 nl, 30 sec) or saline (30 sec) was injected (arrow) into the subthalamic nucleus by using an infusion pump. Control rats were implanted but did not receive any infusion during the experiment. B, Effects of intrapallidal perfusion with the GABAA receptor antagonist (−)-bicuculline on NT-induced (100 nm) glutamate release from the GP of the awake rat. NT was perfused into the striatum for 60 min (solid bar), whereas (−)-bicuculline was added to the pallidal perfusion medium 20 min before the peptide and maintained until the end of the experiment (open bar). The results are expressed as percentage of the mean of the three basal values before treatment. Each point represents the mean ± SEM of six to nine animals. The histograms of the areas under the curves, calculated as percentage of changes in basal value over time (Δ basal percentage × time) by using the trapezoidal rule, are shown on the right. **p < 0.01 significantly different from control; °°p < 0.01 significantly different from (−)-bicuculline plus NT according to one-way ANOVA, followed by the Newman–Keuls test for multiple comparisons.
Fig. 9.
Fig. 9.
A significant positive correlation between intrastriatal NT-induced (1–300 nm) alterations in pallidal GABA and glutamate release was found by evaluating the area under the curve values plotted on the y- andx-axes, respectively. The Spearman correlation coefficient was used.
Fig. 10.
Fig. 10.
Simplified schematic representation of the basal ganglia–thalamocortical neuronal circuitry indicating a possible mechanism underlying the NT-induced increase in striopallidal GABA release (and catalepsy). Inhibitory neurons (GABAergic) are shown asfilled lines, and excitatory neurons (glutamatergic) are shown as open lines. GP, Globus pallidus;STN, subthalamic nucleus; SNr, substantia nigra pars reticulata; Th, thalamus; mCx, motor cortex. A, Untreated control. The striopallidal pathway forms one link in the indirect pathway that projects from the striatum to the basal ganglia output nuclei in the SNr and regulates the inhibitory nigral output to the thalamus. B, Intrastriatal NT. The increase in striatal and pallidal GABA release after intrastriatal NT reflects an activation of the striopallidal GABA transmission leading to a disinhibition of the excitatory STN–SNr and GP transmission. This effect increases the inhibitory drive of the nigrothalamic projections (as well as pallidal glutamate release), probably serving as a feedback to restore activity in the GABA pallidal–subthalamic pathway, thus reducing the activation of the indirect pathway and restoring motor activation. Intrastriatal NT administration has the net effect of decreasing excitatory thalamocortical transmission, resulting in catalepsy. C, Intrapallidal (−)-bicuculline. Intrapallidal GABAAreceptor blockade prevents the intrastriatal NT-induced increase in pallidal glutamate release.

Similar articles

Cited by

References

    1. Agnati LF, Fuxe K, Benfenati F, Battistini N. Neurotensin in vitro markedly reduces the affinity in subcortical limbic [3H]N-propylnorapomorphine binding sites. Acta Physiol Scand. 1983;117:299–301. - PubMed
    1. Albin RL, Young AB, Penney JB. The functional anatomy of basal ganglia disorders. Trends Neurosci. 1989;12:366–375. - PubMed
    1. Alexander GE, Crutcher M. Functional architecture of basal ganglia circuits: neuronal substrates of parallel processing. Trends Neurosci. 1990;13:266–271. - PubMed
    1. Amalric M, Farin D, Dormont JF, Schmied A. GABA-receptor activation in the globus pallidus and entopeduncolar nucleus: opposite effects on reaction time performance in the cat. Exp Brain Res. 1994;102:244–258. - PubMed
    1. Betancour C, Canton M, Gully D, Vela G, Pelaprat D, Rostene W. Characterization and distribution of binding sites for a new neurotensin receptor antagonist ligand, [3H]SR 48692, in the guinea pig brain. J Pharmacol Exp Ther. 1995;273:1450–1458. - PMC - PubMed

Publication types

MeSH terms