

Lanthanum-mediated modification of GABAA receptor deactivation, desensitization and inhibitory synaptic currents in rat cerebellar neurons
- PMID: 9714849
- PMCID: PMC2231154
- DOI: 10.1111/j.1469-7793.1998.647bg.x
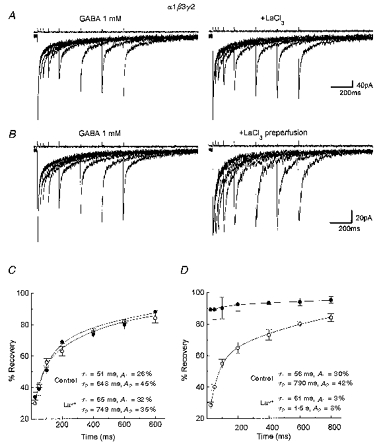
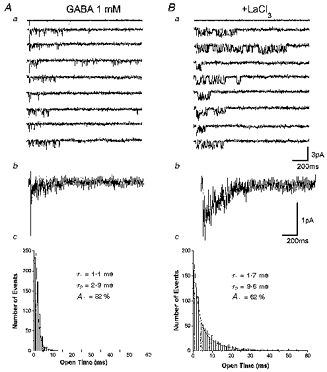
Lanthanum-mediated modification of GABAA receptor deactivation, desensitization and inhibitory synaptic currents in rat cerebellar neurons
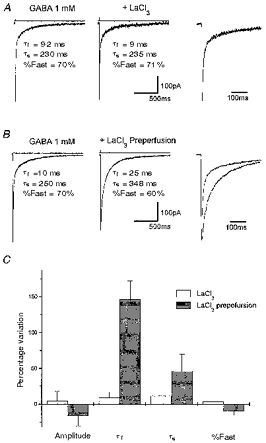
Abstract
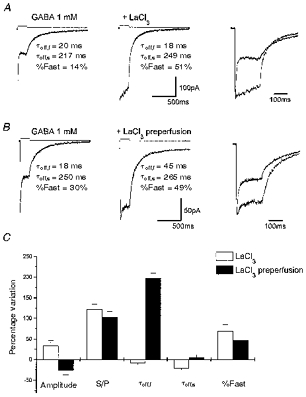
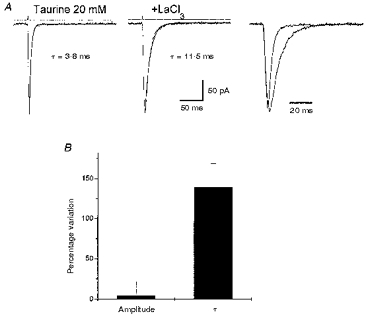
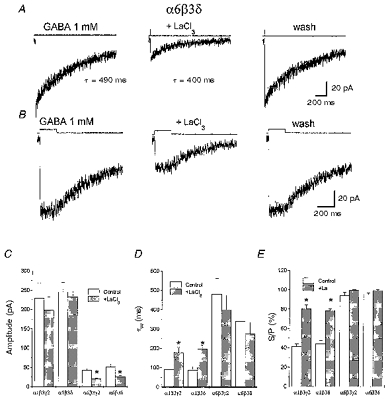
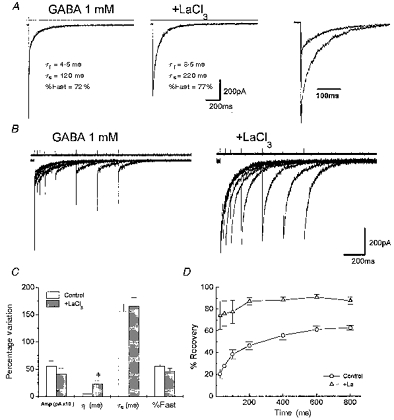
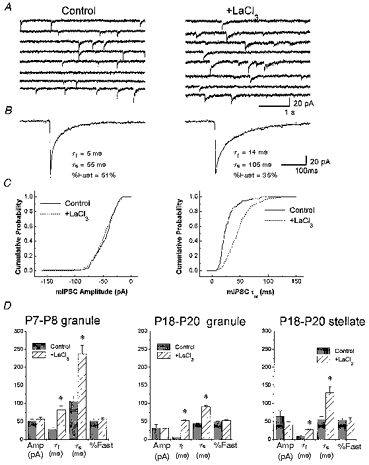
1. We investigated La3+ effects on recombinant and native gamma-aminobutyric acid A (GABAA) receptors using rapid agonist applications and on inhibitory synaptic currents (IPSCs) in granule and stellate neurons of rat cerebellar slices. 2. Rapid desensitization of currents elicited by 200 ms pulses of 1 mM GABA to small lifted cells transfected with alpha1beta3gamma2 cDNAs was greatly decreased by the coapplication of 100 microM LaCl3. 3. GABA responses were unaffected when coapplication lasted only 2 ms. In contrast, with LaCl3 pre-perfusion, a significant slowing of deactivation in response to 2 ms applications was observed. LaCl3 pre-perfusion also prolonged the duration of responses to 20 mM taurine. 4. Outside-out patches excised from cells transfected with alpha1beta3gamma2 subunit cDNAs were briefly exposed to a saturating concentration of GABA, eliciting a transient activation of single channel currents with a main conductance of 30 pS. Opening and burst durations increased by pre-equilibration of patches with LaCl3. 5. LaCl3 depressed the peak amplitude without affecting the slow deactivation and desensitization of GABA responses in cells transfected with alpha6beta3gamma2 and alpha6beta3delta cDNAs. No significant difference in La3+ modulation of GABA-gated currents was observed between alpha1beta3gamma2 and alpha1beta3delta receptors. 6. The effects of LaCl3 on deactivation and desensitization of GABA responses observed in nucleated patches excised from rat cerebellar granule and stellate neurons were comparable to those in the cells transfected with alpha1beta3gamma2 cDNAs. In addition, La3+ clearly prolonged the spontaneous IPSC time course without changing the amplitude. 7. Our results indicate that La3+ has a dual action on GABA-gated currents: it decreases desensitization and increases channel opening duration. These actions depend on receptor subunit composition and contribute to the prolongation of IPSCs.
Figures
References
-
- Copenhagen DR, Jahr CE. Release of endogenous excitatory amino acids from turtle photoreceptors. Nature. 1989;341:536–539. - PubMed
-
- Fritschy JM, Benke D, Mertens S, Oertel WH, Bachi T, Möhler H. Five subtypes of type A γ-aminobutyric acid receptors identified in neurons by double and triple immunofluorescence staining with subunit specific antibodies. Proceedings of the National Academy of Sciences of the USA. 1992;89:6726–6730. - PMC - PubMed
Publication types
MeSH terms
Substances
Grants and funding
LinkOut - more resources
Full Text Sources