. 1998 Sep 15;511 ( Pt 3)(Pt 3):771-89.
doi: 10.1111/j.1469-7793.1998.771bg.x.

Electrophysiological properties of sodium current subtypes in small cells from adult rat dorsal root ganglia

Affiliations

Electrophysiological properties of sodium current subtypes in small cells from adult rat dorsal root ganglia

A M Rush et al. J Physiol. .

Abstract

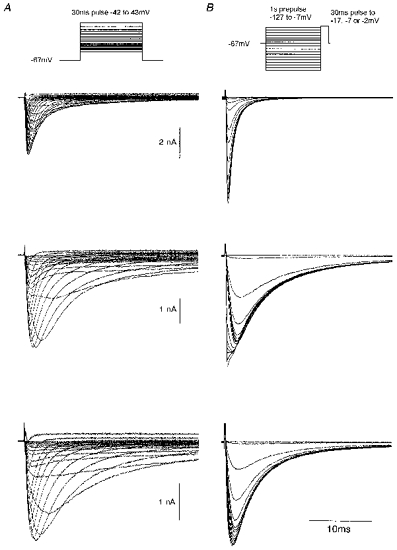
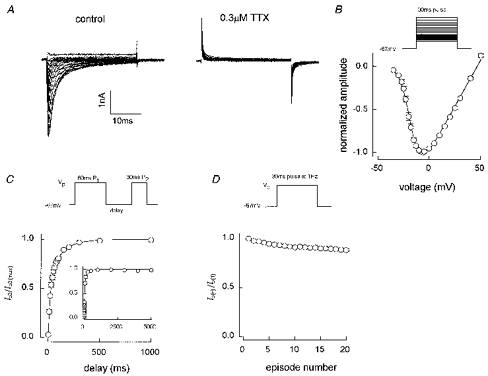
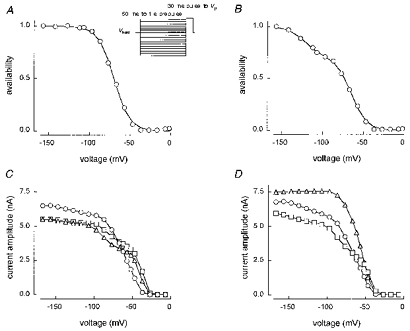
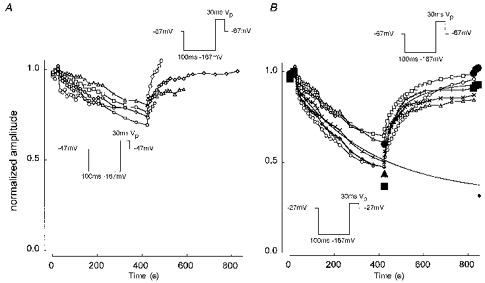
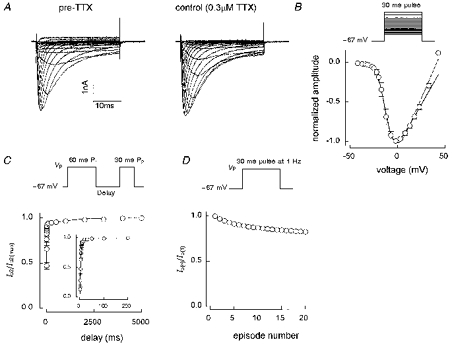
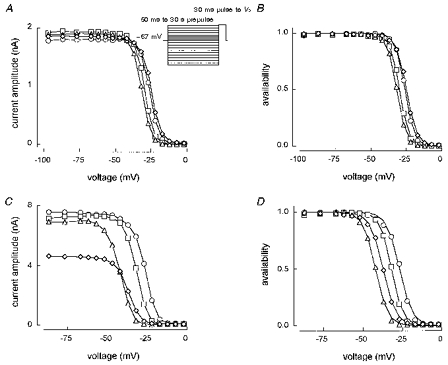
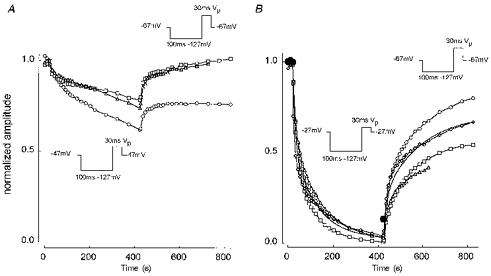
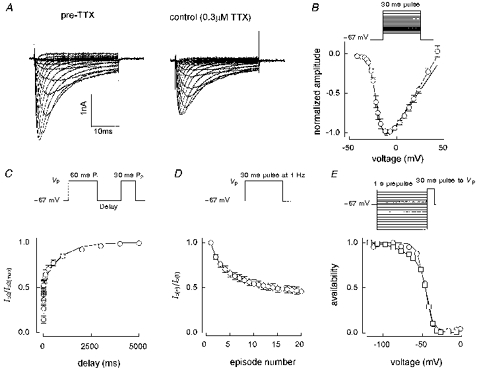
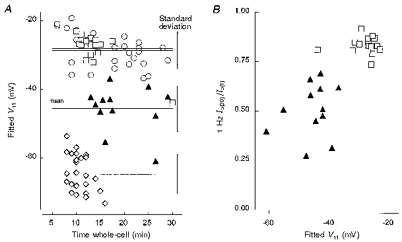
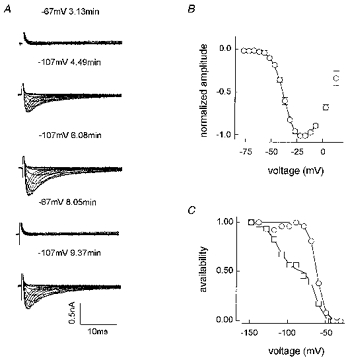
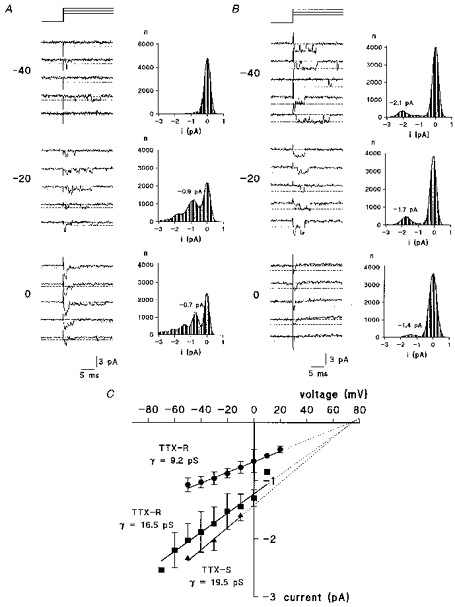
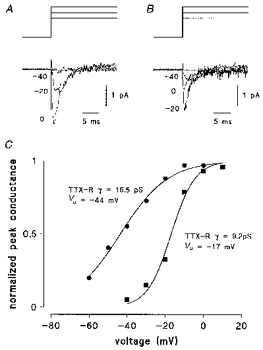
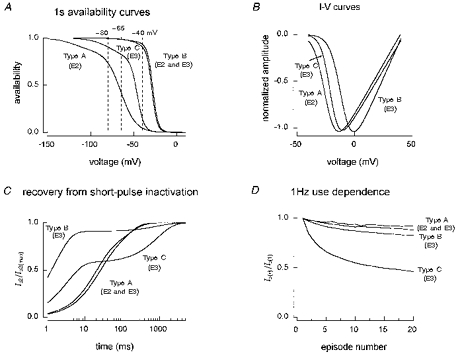
1. Whole-cell and single-channel Na+ currents were recorded from small (ca. 20 micron diameter) cells isolated from adult rat dorsal root ganglia (DRG). Currents were classified by their sensitivity to 0.3 microM tetrodotoxin (TTX), electrophysiological properties and single-channel amplitude. Cells were classified according to the types of current recorded from them. 2. Type A cells expressed essentially pure TTX-sensitive (TTX-S) currents. Availability experiments with prepulse durations between 50 ms and 1 s gave a half-available voltage (Vh) of around -65 mV but the availability curves often had a complex shape, consistent with multiple inactivation processes. Measured inactivation time constants ranged from less than 1 ms to over 100 s, depending on the protocol used. 3. Cell types B and C each had, in addition to TTX-S currents, substantial and different TTX-resistant (TTX-R) currents that we have designated TTX-R1 and TTX-R2, respectively. TTX-R1 currents had a 1 s Vh of -29 mV, showed little 1 Hz use dependence at -67 mV and recovered from the inactivation induced by a 60 ms depolarizing pulse with time constants of 1.6 ms (91 %) and 908 ms. They also exhibited slow inactivation processes with component time constants around 10 and 100 s. TTX-R2 currents activated and inactivated at more negative potentials (1 s Vh = -46 mV), showed substantial 1 Hz use dependence and had inactivation (60 ms pulse) recovery time constants at -67 mV of 3.3 ms (58 %) and 902 ms. 4. Type D cells had little or no current in 0.3 microM TTX at a holding potential of -67 mV. Current amplitude increased on changing the holding potential to -107 mV. Type D cell currents had more hyperpolarized availability and I-V curves than even TTX-R2 currents and suggest the existence of TTX-R3 channels. 5. In outside-out patches with 250 mM external NaCl, the single-channel conductance (gamma) of TTX-S channels was 19.5 pS and the potential for half-maximal activation (Va) was -45 mV. One population of TTX-R channels had a gamma of 9.2 pS and a Va of -27 mV. A second population had a gamma of 16.5 pS and a more negative Va of -42 mV. The latter population may underlie the type D cell current. 6. Small DRG cells express multiple Na+ currents with varied time constants and voltage dependences of activation and inactivation. Nociceptive cells still fire when chronically depolarized by an increased external K+ concentration. TTX-R1 and TTX-R2 Na+ channels may support that firing, while the range of inactivation time constants described here would increase the repertoire of DRG cell burst firing behaviour generally.


Figures

Figure 1
Figure 1. Examples of currents recorded from small DRG cells in the absence of TTX
I-V families (A) and 1 s availability families (B) are shown for cells chosen to demonstrate: top, a pure fast current (cell E6410); middle, a mix with a substantial fast component (cell L6410); and bottom, a mix with a small fast component (cell C6429). Solution E3/I1.
Figure 2
Figure 2. Characteristics of TTX-S currents in type A cells
A, an I-V family before and after application of 0.3 μm TTX (cell G4531) and B, an I-V curve constructed from meaned normalized data (n = 8, all data recorded between 5 and 7 min after going whole-cell). The fit shown gave Va= -25 mV. Meaned data from 13 short-pulse inactivation recovery experiments are shown in the main panel of C with 1 Hz use dependence data from the same 13 cells given in D. The inset to C shows the mean of 3 recovery experiments followed to 5 s rather than 1 s. The double-exponential fit in the main panel of C gave: f1= 0.55, τ1= 19.6 ms, τ2= 110.7 ms, r2= 0.999. The inset fit gave: f1= 0.66, τ1= 18.0 ms, τ2= 137.4 ms, r2= 0.999. The 20th current in a 1 Hz train was 92 % of the first pulse current amplitude (D). Solution E2/I1 except for the inset to C, which was E3/I1.
Figure 3
Figure 3. Type A cell availability curves
A and B: normalized 1 s availability curves from cell F4531 and G4531, respectively. Vhold was -67 mV. The single Boltzmann fit shown to F4531 gave: Vh= -70 mV, kh= 9.7 mV, r2= 0.999. The double Boltzmann fit to G4531 gave: f1= 0.71, Vh1= -65 mV, kh1= 9.4 mV, Vh2= -122 mV, kh2= 10.1 mV, r2= 0.999. C, non-normalized 50 ms (▵), 1 s (○) and 50 ms (□) availability curves from ARAT19, Vhold= -67 mV. D, non-normalized 100 ms (□) and 1 s (○), Vhold= -67 mV and 200 ms (▵), Vhold= -107 mV curves from ARAT19. Solution E2/I1 (A and B) and E3/I1 (C and D).
Figure 4
Figure 4. Slow inactivation of TTX-S currents
A, development of slow inactivation at -47 mV with recovery at -67 mV. Cells were prepulsed to -167 mV for 100 ms to remove ‘fast’ inactivation and pulsed to Vp for 30 ms to measure the available current. Vhold was switched from -67 to -47 mV after 3 pulses (taking 20 s in total) and left at -47 mV for 400 s (20 pulses) before returning to -67 mV for a further 400 s (20 pulses). Cells ARAT42 (○), 52 (□), 64 (▵), 71 (⋄) and 73 (○). Currents were normalized with respect to the largest of the first three (Vhold -67 mV). B, development of slow inactivation at -27 mV with recovery at -67 mV. The open symbols show experiments that followed a similar protocol to that in A. Cells ARAT52 (○), 56 (□), 64 (▵), 67 (⋄) and 69 (○). The smooth lines are double-exponential fits to the development and recovery phases of the mean of ARAT52, 56, 71 and 73. The fitting parameters are given in the text. The development phase is shown extended to 850 s; the amplitude at infinite time was 0.31 (i.e. 31 % of the initial amplitude) and is shown by the small ♦. Large filled symbols indicate ‘no-use’ procotols where no pulses were applied during the development phase and only one at the start of the recovery phase. Cells ARAT74 (•), 75 (▪) and 78 (▴). Solution E3/I1.
Figure 5
Figure 5. Characteristics of TTX-R currents in type B cells
A, an I-V family before and after application of 0.3 μm TTX (cell D6422) and B, an I-V curve constructed from meaned normalized data (n = 4, all data recorded between 4 and 6 min after going whole-cell). Fits are shown to all voltages (dashed line, Va= -11 mV) and up to 23 mV (continuous line, Va= -12 mV). Meaned data from 9 short-pulse inactivation recovery experiments are shown in the main panel of C with 1 Hz use dependence data from the same 9 cells given in D. The inset to C shows the mean of 5 recovery experiments with a shorter time scale (200 ms rather than 5 s). The double-exponential fit shown in the main panel of C gave: f1= 0.91, τ1= 1.6 ms, τ2= 908 ms, r2= 0.994. The single exponential fit in the inset gave: τ= 4.1 ms, r2= 0.982. The 20th current in a 1 Hz train was 83 % of the first pulse current amplitude. Solution E3/I1 except for the inset to C, which was E2/I1.
Figure 6
Figure 6. Type B cell availability curves with prepulse durations between 50 ms and 30 s
Vhold= -67 mV. A and B, cell A5O26: 200 ms dataset (9.38 min, ○), 500 ms dataset (13.01 min, □), 1 s dataset (15.52 min, ▵), 50 ms dataset (19.48 min, ⋄). Single Boltzmann fits are shown in B with Vh= -26, -30, -32 and -25 mV and kh= 3.3, 3.3, 3.4 and 3.7 mV (r2= 0.999). C and D, cell F4621: first 1 s dataset (10.11 min, ○), 5 s dataset (12.48 min, □), 30 s dataset (21.30 min, ▵), second 1 s dataset (38.57 min, ⋄). Single Boltzmann fits are shown in D with Vh= -27, -32, -42 and -37 mV and kh= 4.1, 3.6, 3.9 and 4.1 mV (r2= 0.998-0.999). Solution E2/I1.
Figure 7
Figure 7. Slow inactivation of essentially TTX-R1 currents recorded without 0.3 μm TTX
Protocols similar to Fig. 4 except prepulse to -127 mV sufficient to remove ‘fast’ inactivation. A, development at -47 mV and recovery at -67 mV. Cells ARAT41 (○), 61 (□) and 68 (▵). B, development at -27 mV and recovery at -67 mV. Standard protocols, cells ARAT41 (○), 53 (□), 55 (▵) and 61 (⋄). No-use protocol, ARAT76 (•). The smooth lines in B show double-exponential fits to meaned development and recovery phases, with parameters given in the text. Solution E3/I1.
Figure 8
Figure 8. Characteristics of TTX-R currents in type C cells
A, an I-V family before and after application of 0.3 μm TTX (cell B6401) and B, an I-V curve constructed from meaned normalized data (n = 4, all data recorded between 5 and 7 min after going whole-cell). Fits are shown to all voltages (dashed line, Va= -21 mV) and up to 23 mV (continuous line, Va= -21 mV). Meaned data from 9 short-pulse inactivation recovery experiments are shown in C with 1 Hz use dependence data from the same 9 cells given in D. The double-exponential fit in C gave: f1= 0.58, τ1= 3.3 ms, τ2= 902 ms, r2= 0.994. The fast and slow time constants are similar to those for type B cells but the contribution of the slow time constant is much greater in type C cells. The 20th current in a 1 Hz train was 46 % of the first pulse current amplitude. E, 1 s availability curves from cell I6311 (○) and B6325 (□). The single Boltzmann fit shown to I6311 gave: Vh= -46 mV, kh= 4.8 mV, r2= 0.995. The double Boltzmann fit to B6325 gave: f1= 0.77, Vh1= -44 mV, kh1= 3.9 mV, Vh2= -71 mV, kh2= 11.5 mV, r2= 0.999. Solution E3/I1. Vhold -67 mV throughout.
Figure 9
Figure 9. Comparison of Vh1 data from type A, B and C cells
A, scatterplots showing fitted Vh1 values against time after going whole-cell for TTX-S currents in type A cells (E2/I1, ⋄) and TTX-R currents in type B (E2/I1, ○; E3/I1, □) and type C cells (E3/I1, ▴). The horizontal lines show the mean value for each sample while the vertical bars to the right give the standard deviation. These are similar for each sample but largest for the type C cells. There is little overlap between putative TTX-R type 1 and type 2 currents. B, a scatterplot showing the level of 1 Hz use dependence of TTX-R currents in type B (E3/I1, □) and type C (E3/I1, ▴) cells.
Figure 10
Figure 10. Characteristics of TTX-R currents in type D cells
A, I-V families at Vhold= -67 and -107 mV from cell G6311 (not leak subtracted, solution E3/I1). The starting time for collection of each dataset is shown next to Vhold (3.13 min = 3 min 13 s). A 20 s leak dataset at the same Vhold followed each dataset shown, so the time between changing Vhold and initiating recording was actually ca. 30 s. B, a meaned normalized I-V curve (n = 8, Vhold= -107 mV, solution E3/I1). The fit shown up to -7 mV gave Va= -36 mV. C, 1 s availability curves for cell 278916 (○) and 208912 (□), Vhold= -67 mV. The single Boltzmann fit shown to 278916 gave: Vh= -63 mV, kh= 5.1 mV, r2= 0.997. The double Boltzmann fit to 208912 gave: f1= 0.50, Vh1= -73 mV, kh1= 5.0 mV, Vh2= -113 mV, kh2= 8.3 mV, r2= 0.997 (solution E1/I1).
Figure 11
Figure 11. Properties of two different types of TTX-R Na+ channels in dorsal root ganglion neurones
A and B, traces of single channels recorded from two different cells in 250 mM extracellular Na+ solution (E4/I2) and 0.3 μm TTX at 3 different test potentials as given to the left of the traces. Dotted lines represent closed and first open level as obtained from point amplitude histograms. Filter frequency was 2 kHz. Point amplitude histograms were constructed from recordings at various test potentials during the first 10 ms from onset of stimulus. Single-channel amplitude was determined as the amplitude difference in Gaussian fits of the closed and the first open level. In histograms where no peak could be detected, e.g. in A at -40 mV, single-channel amplitude was measured by eye. Bin width is 0.05 pA in all histograms. C, plot of single-channel amplitude versus test potential. Single-channel conductance is calculated from the slope of the linear regression lines.
Figure 12
Figure 12. Kinetics and activation voltage dependence of averaged single-channel currents
A and B, averaged currents of 200 single-channel recordings as shown in Fig. 11, demonstrating the time course of the current. C, activation curve of the peak Na+ current as measured from averaged traces in A and B. Fitting the data points to a single Boltzmann equation gives half-maximal activation potentials, Va.
Figure 13
Figure 13. Characteristics of currents in cell types A-C
1 s availability (A), I-V (B) and inactivation recovery (C) curves plotted from the functions that best fit the experimental data. D, experimental 1 Hz use dependence. TTX-R1 channels in type B cells are the most resistant to inactivation (A) but also have the highest threshold for activation (B). TTX-R2 channels in type C cells have the largest slow component of recovery from inactivation and the highest use-dependent block at 1 Hz. TTX-R1 channels largely recover quickly from inactivation at -67 mV but do exhibit a small slow component. TTX-R1 currents therefore have a slightly higher degree of 1 Hz use dependence than TTX-S currents. However, TTX-R1 currents are 91 % recovered after 10 ms, at which time TTX-S currents are only 26 % recovered.

References

    1. Akopian AN, Sivilotti L, Wood JN. A tetrodotoxin-resistant voltage-gated sodium channel expressed by sensory neurones. Nature. 1996;379:257–262. 10.1038/379257a0. - DOI - PubMed
    1. Arbuckle JB, Docherty RJ. Expression of tetrodotoxin-resistant sodium channels in capsaicin-sensitive dorsal root ganglion neurones of adult rats. Neuroscience Letters. 1995;185:70–73. 10.1016/0304-3940(94)11227-A. - DOI - PubMed
    1. Black JA, Dib-Hajj S, McNabola K, Jeste S, Rizzo MA, Kocsis JD, Waxman SG. Spinal sensory neurons express multiple sodium channel α-subunit mRNAs. Molecular Brain Research. 1996;43:117–131. - PubMed
    1. Bräu ME, Rush AM, Elliott JR. Single channel analysis of two types of tetrodotoxin-resistant sodium channels (TTX-r INa) in small cells isolated from adult rat (200-350 g) dorsal root ganglia (DRG) The Journal of Physiology. 1995;487.P:184. P.
    1. Buchanan S, Harper AA, Elliott JR. Differential effects of tetrodotoxin (TTX) and high external K+ on A and C fibre compound action potential peaks in frog sciatic nerve. Neuroscience Letters. 1996;219:131–134. - PubMed

Publication types

LinkOut - more resources