

Quantitative intracellular cytokine measurement: age-related changes in proinflammatory cytokine production
- PMID: 9717970
- PMCID: PMC1905038
- DOI: 10.1046/j.1365-2249.1998.00641.x
Quantitative intracellular cytokine measurement: age-related changes in proinflammatory cytokine production
Abstract
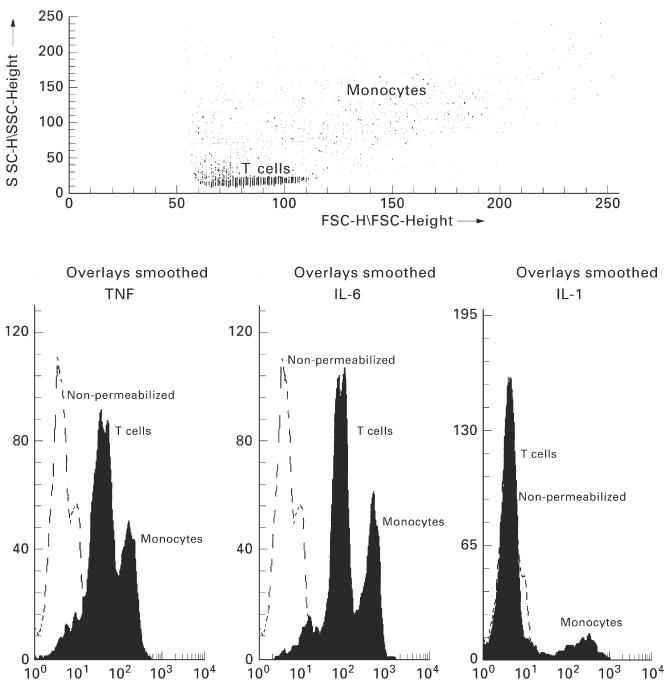
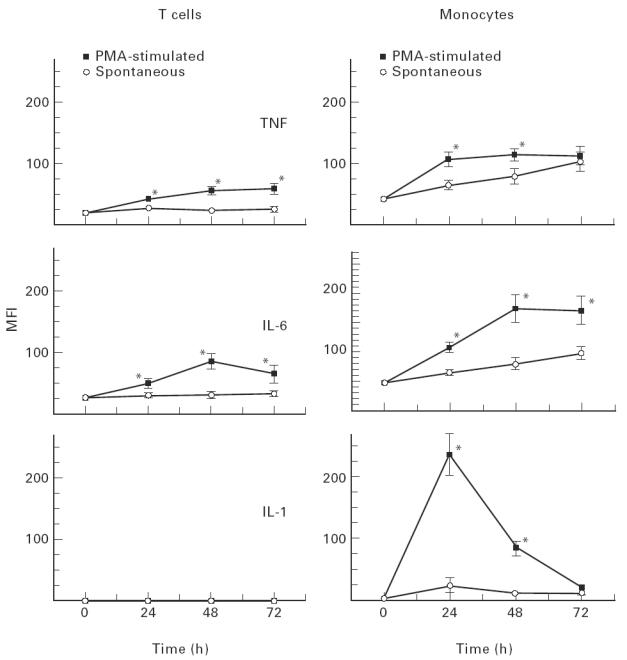
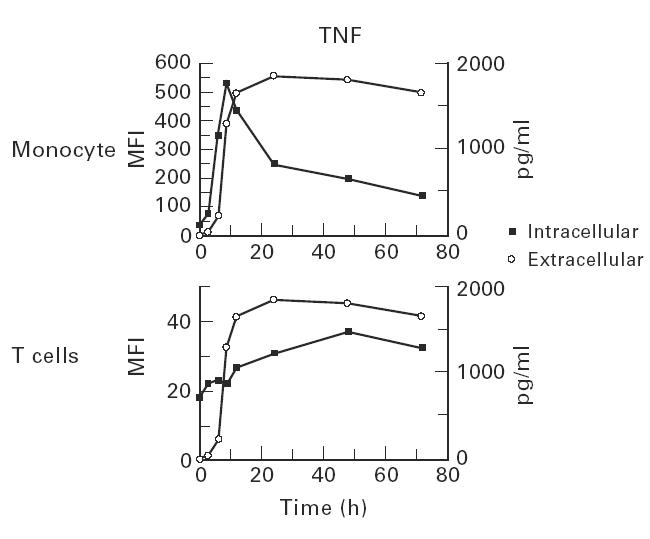
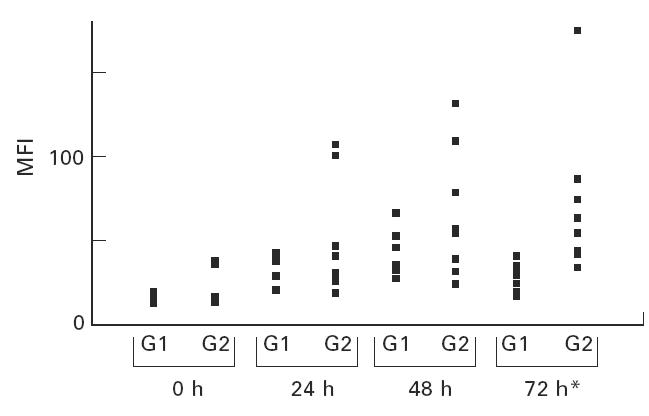
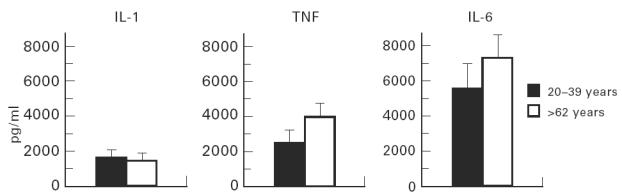
The proinflammatory cytokines play a central role in mediating cellular and physiological responses, and levels may reflect immune system effectiveness. In this study, the effect of ageing on the inflammatory response was examined using a novel method to detect production of the proinflammatory cytokines, i.e. tumour necrosis factor-alpha (TNF-alpha), IL-6 and IL-1beta. Peripheral blood mononuclear cells (PBMC) obtained from healthy donors of different ages were incubated for 0, 24, 48 and 72 h with or without phorbol 12-myristate 13-acetate (PMA) stimulation. At each time point these cells were permeabilized and incubated with secondary conjugated FITC MoAbs specific for each cytokine. A flow cytometric system was developed to quantify specific intracellular fluorescence in T cells (CD3+) and monocytes (CD14+). TNF-alpha, IL-6 and IL-1beta production in cell culture supernatants was also measured using ELISAs. In older subjects, flow cytometry detected significant increases in intracellular T cell TNF-alpha and IL-6 (P < 0.05). IL-1beta was not detected in any of the T cell samples. Likewise, the monocytes of older subjects demonstrated increased intracellular levels of all three cytokines, but these increases were not significant (P > 0.05). These changes in intracellular proinflammatory cytokine levels may explain some of the exaggerated inflammatory responses seen in elderly patients.
Figures
References
-
- Pawelec G, Adibzadeh M, Pohla H, Schaudt K. Immunosenescence: ageing of the immune system. Immunol Today. 1995;16:420–2. - PubMed
-
- Kishimoto T. Factors affecting B cell growth and differentiation. Annu Rev Immunol. 1985;3:133–9. - PubMed
-
- Le J, Vilcek J. Tumour necrosis factor and interleukin-1: cytokines with multiple overlapping biological activities. Lab Invest. 1987;56:234–41. - PubMed
-
- Akira S, Hirano T, Taga T, Kishimoto T. Biology of multifunctional cytokines: IL-6 and related molecules (IL-1 and TNF) FASEB. 1990;J4:2860–5. - PubMed
-
- Dinarello CA, Wolf SM. Molecular basis of fever in humans. Am J Med. 1982;72:779–87. - PubMed
Publication types
MeSH terms
Substances
LinkOut - more resources
Full Text Sources
Other Literature Sources
Medical
Research Materials
