. 1998 Aug 24;142(4):963-73.
doi: 10.1083/jcb.142.4.963.

Differential modulation of SERCA2 isoforms by calreticulin

Affiliations

Differential modulation of SERCA2 isoforms by calreticulin

L M John et al. J Cell Biol. .

Abstract

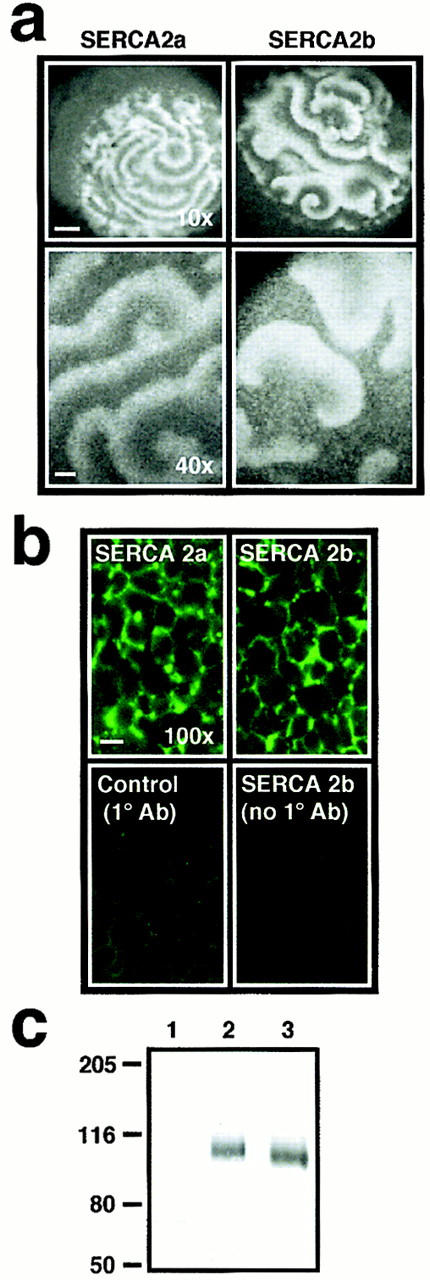
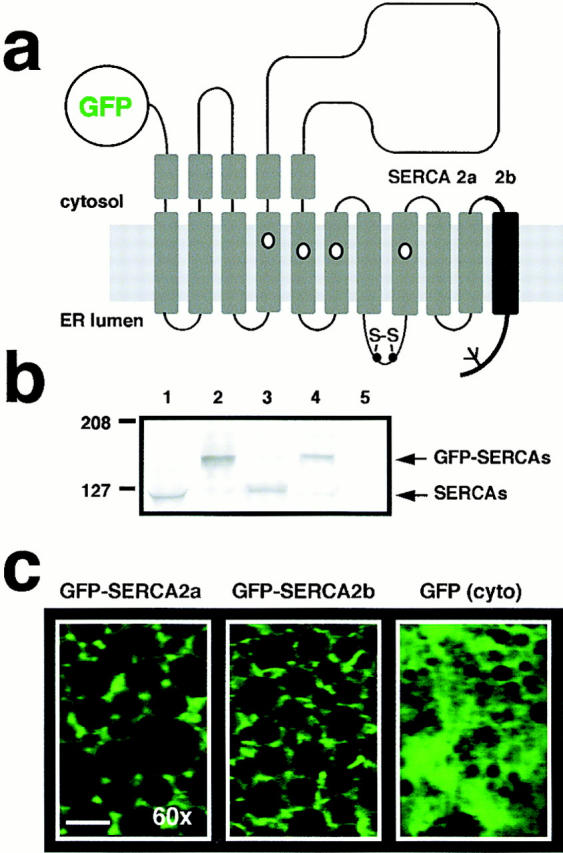
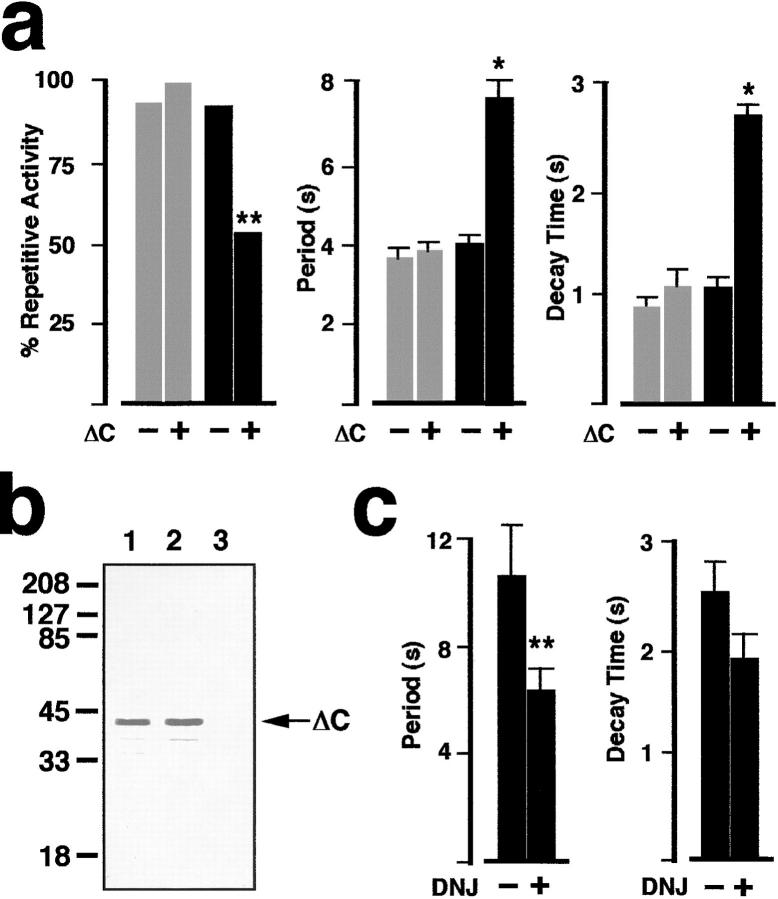
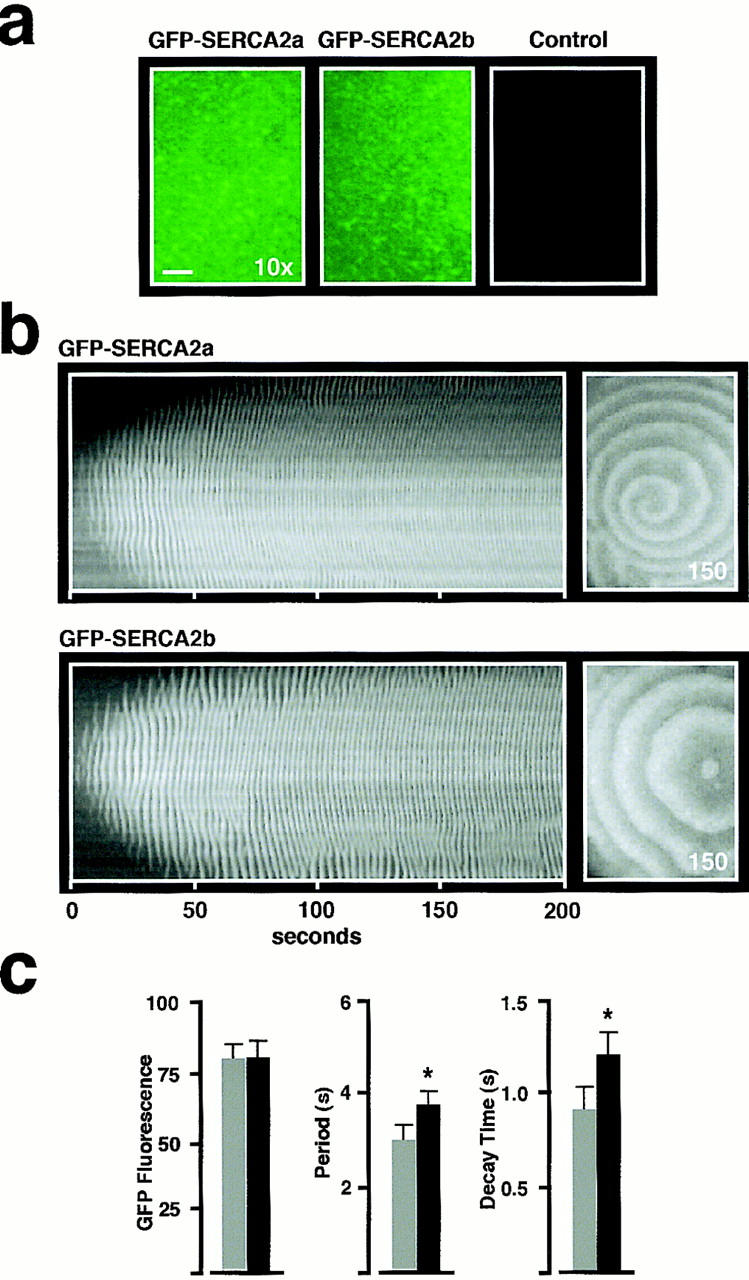
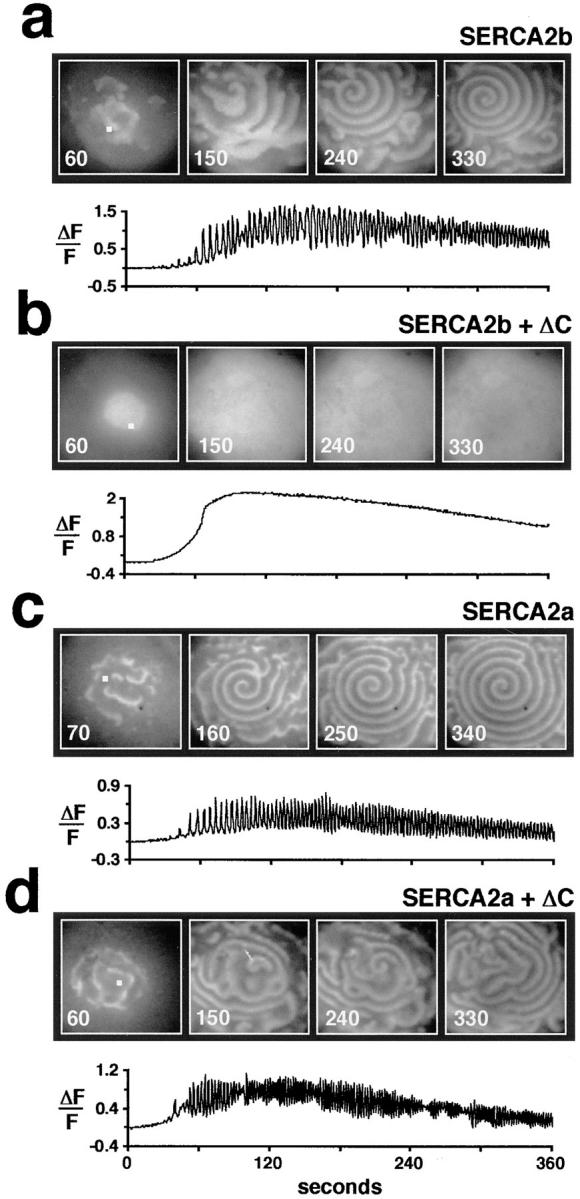
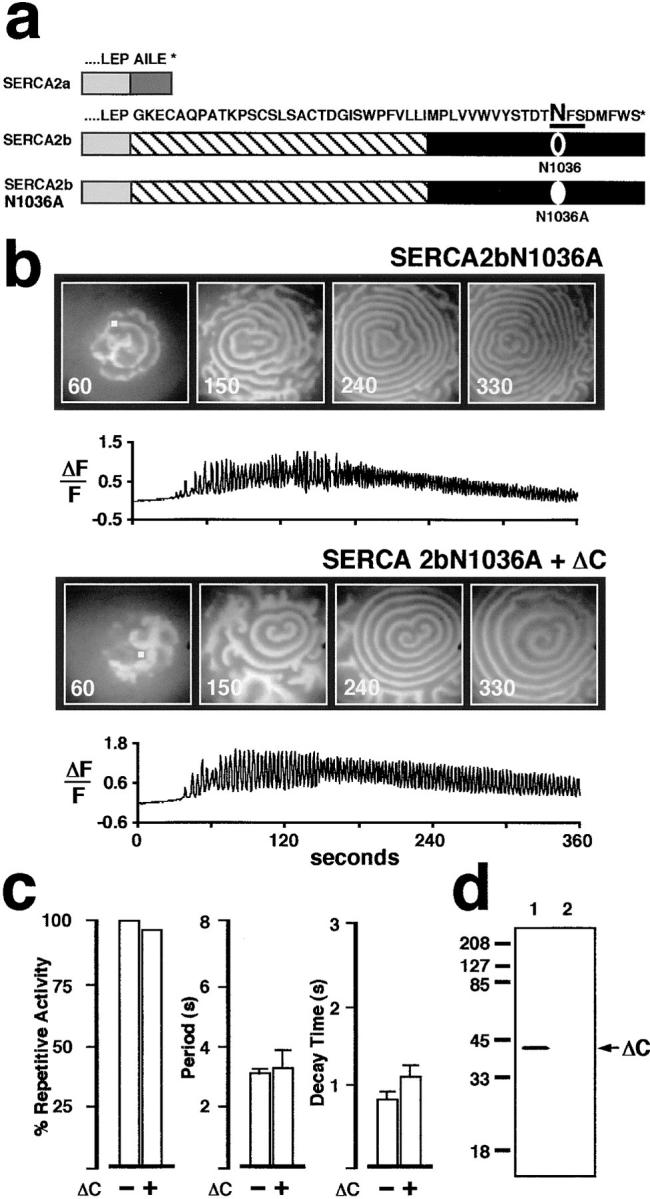
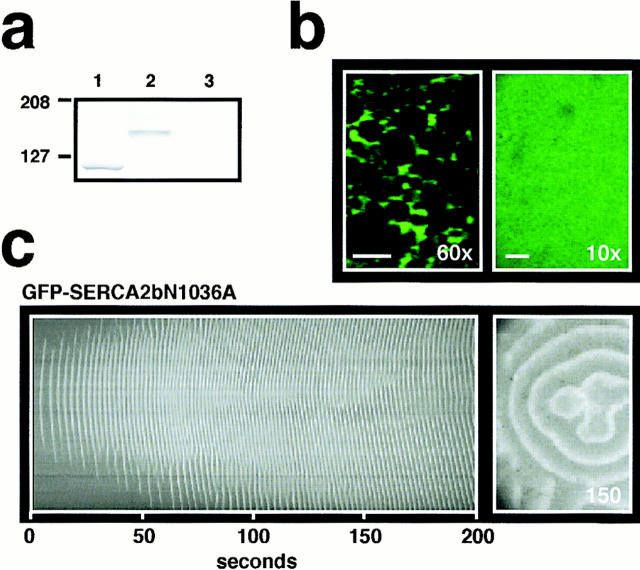
In Xenopus laevis oocytes, overexpression of calreticulin suppresses inositol 1,4,5-trisphosphate-induced Ca2+ oscillations in a manner consistent with inhibition of Ca2+ uptake into the endoplasmic reticulum. Here we report that the alternatively spliced isoforms of the sarcoendoplasmic reticulum Ca2+-ATPase (SERCA)2 gene display differential Ca2+ wave properties and sensitivity to modulation by calreticulin. We demonstrate by glucosidase inhibition and site-directed mutagenesis that a putative glycosylated residue (N1036) in SERCA2b is critical in determining both the selective targeting of calreticulin to SERCA2b and isoform functional differences. Calreticulin belongs to a novel class of lectin ER chaperones that modulate immature protein folding. In addition to this role, we suggest that these chaperones dynamically modulate the conformation of mature glycoproteins, thereby affecting their function.


Figures

Figure 1
Figure 1
Overexpression of SERCA2a and SERCA2b reveals functional differences between isoforms in IP3-induced repetitive Ca2+ wave activity. (a) Comparison of the IP3 (∼300 nM final)-induced Ca2+ response in a SERCA2a (left) and a SERCA2b (right)- overexpressing oocyte. In the top two panels the confocal images are 745 μm × 745 μm and are imaged at low magnification (10× objective; bar, ∼100 μm). In the bottom two panels, two different oocytes are confocally imaged at higher magnification (40× objective; bar, ∼20 μm) and the confocal images are 240 μm × 180 μm. Individual images of Ca2+ wave activity were taken at peak activity. (b) Confocal immunofluorescence of SERCA2a and SERCA2b. The top panels show immunofluorescence obtained with a primary antibody to rat SERCAs generated in rabbit (C-4, gift of J. Lytton) and a secondary FITC-conjugated goat anti– rabbit antibody (Jackson ImmunoResearch Laboratories). The bottom panels are controls. The left panel shows immunofluorescence of a control oocyte (not injected with SERCA2 message) revealing endogenous levels of cross-reactivity with the native Xenopus oocyte SERCA2b protein. The right panel shows control immunofluorescence omitting the primary antibody. Bar, ∼10 μm. (c) Western blot of SERCA2 protein levels in either control oocytes injected with H2O (lane 1) or oocytes overexpressing SERCA2b (lane 2) and SERCA2a (lane 3) mRNAs. SERCA2 products were detected by probing with the same C-4 primary antibody used in b. One oocyte equivalent was loaded per lane and run on an 8% SDS PAGE gel. Molecular size markers (in kD) are indicated on the left (Hi range; Bio-Rad Laboratories).
Figure 2
Figure 2
Overexpression of GFP-SERCA2 fusion constructs reveals functional differences in SERCA2a and SERCA2b. (a) Cartoon view of the fusion constructs used to tag SERCA isoforms at the NH2 terminus with the S65T increased fluorescence mutant of GFP. (b) Western blot analysis demonstrates overexpression of GFP-SERCA2 fusion products detected by probing the membrane with a polyclonal anti-SERCA2 antibody that was raised in rabbit against a recombinant His-tagged fragment encompassing most of the cytoplasmic loop between M4 and M5 from rat SERCA2 (N1, gift of J. Lytton). Wild-type SERCA2a and SERCA2b (lanes 1 and 3, respectively) migrated ∼27 kD below fusion protein products contained in extracts from oocytes overexpressing GFP-SERCA2a and GFP-SERCA2b (lanes 2 and 4, respectively). Oocyte extracts from control oocytes (H2O replacing mRNA) were run on lane 5. Molecular size markers (in kD) are indicated on the left (Kaleidoscope; Bio-Rad Laboratories). (c) High magnification confocal images of GFP fluorescence in oocytes overexpressing GFP-SERCA2a and GFP-SERCA2b fusion proteins (left and middle, respectively). Note that fluorescence is confined to the ER corridors between yolk platelets. A control oocyte overexpressing cytosolic GFP is shown (right). In this oocyte, fluorescence is more diffuse. Images are 52 μm × 36 μm, and were acquired with an OZ confocal laser scanning microscope (Noran Instruments, Middleton, WI). The oocytes were excited at 488 nm and imaged with a 60× water immersion objective. Bar, ∼10 μm.
Figure 5
Figure 5
ΔC inhibition of repetitive Ca2+ waves and reversal of the ΔC effect by glucosidase inhibitors. (a) The percent of oocytes exhibiting repetitive Ca2+ oscillations is significantly reduced in oocytes coexpressing ΔC with SERCA2b (black bars), but not in oocytes coexpressing ΔC with SERCA2a (gray bars; **P < 0.01, Chi-squared test). Of those oocytes that did display repetitive Ca2+ oscillations, the interwave period (middle histogram) and decay time (right histogram) were significantly increased in oocytes coexpressing ΔC with SERCA2b when compared with control oocytes overexpressing SERCA2b alone (*P < 0.005). No significant differences were found between oocytes coexpressing ΔC with SERCA2a as compared with control oocytes overexpressing SERCA2a alone in either interwave period or in decay time of individual waves. Note that there is a change in scale values for the ordinate in histograms of wave period and decay time with respect to Fig. 3 c. The larger scale in this figure reflects the longer period and longer decay time of Ca2+ waves in SERCA2b + ΔC-overexpressing oocytes. (b) Western blot analysis demonstrates overexpression of the ΔC mutant of CRT in fractions from oocytes coexpressing this calreticulin mutant with SERCA2a (lane 1) and SERCA2b (lane 2). Oocyte extracts from control oocytes (H2O replacing mRNA) were run on lane 3. The membrane was probed with a primary anti-CRT KDEL Ab that recognizes the last six amino acids at the COOH terminus of rabbit CRT (gift of Michalak). (c) Glucosidase inhibition antagonizes the effects of ΔC overexpression on oscillatory Ca2+ waves. Period between waves in SERCA2b + ΔC-overexpressing oocytes is significantly decreased (n = 13) in oocytes injected with 1 mM final DNJ (Toronto Research Chemicals, North York, Ontario, Canada) when compared with uninjected SERCA2b + ΔC control oocytes (n = 18). **Indicates statistical significance at P < 0.025. In the same groups of oocytes, decay time of individual Ca2+ waves is also reduced, although the differences are not statistically significant.
Figure 3
Figure 3
GFP-SERCA2 isoforms retain the characteristics of their respective unmodified proteins and at equivalent levels of expression exhibit different Ca2+ wave characteristics. (a) Fluorescence images in GFP-SERCA2a (left) and GFP-SERCA2b (middle) overexpressing oocytes that have been matched for equivalent levels of GFP fluorescence intensity. GFP fluorescence (745 μm × 530 μm) was excited at 488 nm. Note that under these imaging conditions, fluorescence levels in control oocytes (injected with H2O instead of GFP-SERCA2 mRNA) are not detectable. For quantitation of overexpression levels of GFP fusion proteins, fluorescence values were measured from images obtained at a low magnification (10× objective; bar, ∼100 μm). (b) Spatio-temporal patterns (left) of Ca2+ release induced by injection of IP3 (∼300 nM final) in oocytes as labeled. In this experiment, Ca2+ Orange (Molecular Probes, Inc.) was used as indicator of Ca2+ wave activity so that GFP fluorescence and Ca2+ wave activity could be observed in the same oocyte. GFP(S65T) absorption and emission maxima in the visible spectrum occur at 490 and 509 nm, respectively, while for Ca2+ Orange these are 590 nm and 650 nm, respectively. Thus, for the imaging parameters used, Ca2+ Orange fluorescence does not overlap with GFP fluorescence emission. Each temporal stack contains 400 images taken at 0.5-s intervals. A single image (530 μm × 745 μm) of Ca2+ wave activity is shown at the indicated time (right). (c) At equivalent levels of GFP fluorescence, the Ca2+ wave properties are different for oocytes overexpressing GFP-SERCA2a (gray bars, n = 13) and GFP-SERCA2b (black bars, n = 10). Histogram of GFP fluorescence (left) shows fluorescence intensity measurements in arbitrary units. Histogram of Ca2+ wave period (middle) and Ca2+ wave decay time (right) measure each of these parameters from the time course of the average fluorescence intensity of a 5 × 5 pixel area. Note that GFP-SERCA2a-overexpressing oocytes display a higher Ca2+ wave frequency (i.e., shorter periods) than the GFP-SERCA2b-overexpressing oocytes. * Indicates a statistically significant difference at P < 0.005.
Figure 4
Figure 4
ΔC inhibits Ca2+ oscillations when coexpressed with SERCA2b, but not when coexpressed with SERCA2a. (a and b) Comparison of the IP3 (∼300 nM)-induced Ca2+ wave activity in a SERCA2b-overexpressing oocyte with the Ca2+ wave activity of a SERCA2b + ΔC-coexpressing oocyte. (c and d) Comparison of the IP3 (∼300 nM)-induced Ca2+ wave activity in a SERCA2a-overexpressing oocyte with the Ca2+ wave activity of a SERCA2a + ΔC-coexpressing oocyte. Individual confocal images (745 μm × 745 μm) of Ca2+ wave activity were taken at the indicated times. The bottom trace in each panel represents the change in fluorescence (ΔF/F) shown as a function of time for a 5 × 5 pixel area (white square in the first panel of each image).
Figure 6
Figure 6
Site-directed mutagenesis of SERCA2b residue N1036 creates a protein that is no longer responsive to ΔC coexpression, and that resembles SERCA2a. (a) Amino acid sequence comparison between the COOH terminus of SERCA2a and SERCA2b. The eleventh transmembrane segment of SERCA2b is shown (hatched). The consensus N-linked glycosylation motif is underlined, and the mutated residue N1036A is indicated in bold. (b) Comparison of Ca2+ wave activity in two oocytes overexpressing SERCA2bN1036A (top) or SERCA2bN1036A + ΔC (bottom). (c) The left histogram shows percent of oocytes exhibiting repetitive Ca2+ oscillations when SERCA2bN1036A is expressed alone or with ΔC. Of those oocytes that displayed repetitive Ca2+ oscillations, no significant differences were found in either interwave period (middle histogram) or in decay time (right histogram) between oocytes coexpressing ΔC with SERCA2bN1036A and control oocytes overexpressing SERCA2bN1036A alone. These results are similar to those observed for SERCA2a and SERCA2a + ΔC-overexpressing oocytes (see Fig. 4 b). (d) Western blot analysis demonstrates overexpression of ΔC in fractions from SERCA2bN1036A + ΔC oocytes (lane 1). No detectable CRT product was observed in extracts from control oocytes (H2O replacing mRNA) (lane 2). The membrane was probed with the anti-CRT KDEL primary Ab from Fig. 4 c.
Figure 7
Figure 7
Residue N1036 is critical in determining the functional differences between SERCA2 isoforms. (a) Differential migration patterns between SERCA2bN1036A (lane 1) vs. GFP-SERCA2bN1036A (lane 2) on a Western blot probed with the same N1 anti-SERCA2 Ab from Fig. 2 b. Fractions from control oocytes (H2O replacing mRNA) were run on lane 3. (b) Confocal images of GFP fluorescence intensity at high resolution (60× objective; 52 μm × 36 μm) and at low resolution (10× objective; 745 μm × 530 μm) in a GFP-SERCA2bN1036A oocyte matched for GFP fluorescence intensity with the oocytes shown in Fig. 3 a. (c) Spatiotemporal stack (left) of Ca2+ wave activity from the GFP-SERCA2bN1036A overexpressing oocyte in b. Confocal image of Ca2+ wave activity at the indicated time (right). Imaging parameters were similar to those described in Fig. 3 b.

References

    1. Baksh S, Burns K, Andrin C, Michalak M. Interaction of calreticulin with protein disulfide isomerase. J Biol Chem. 1995;270:31338–31344. - PubMed
    1. Bastianutto C, Clementi E, Codazzi F, Podini P, De Giorgi F, Rizzuto R, Meldolesi J, Pozzan T. Overexpression of calreticulin increases the Ca2+ capacity of rapidly exchanging Ca2+stores and reveals aspects of their luminal microenvironment and function. J Cell Biol. 1995;130:847–855. - PMC - PubMed
    1. Bayle D, Weeks D, Sachs G. The membrane topology of the rat sarcoplasmic and endoplasmic reticulum calcium ATPases by in vitro translation scanning. J Biol Chem. 1995;270:25678–25684. - PubMed
    1. Bergeron JJM, Brenner MB, Thomas DY, Williams DB. Calnexin: a membrane-bound chaperone of the endoplasmic reticulum. Trends Biochem Sci. 1994;19:124–128. - PubMed
    1. Berridge MJ. Inositol trisphosphate and calcium signaling. Nature. 1993;361:315–325. - PubMed

Publication types

MeSH terms